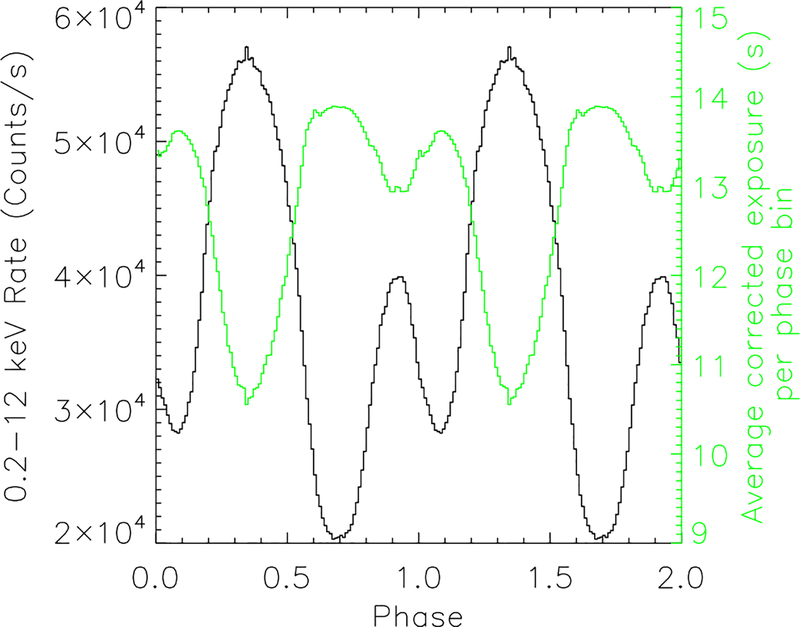
Figure 3.
Swift J0243.6+6124 folded pulse profile (two cycles plotted) of one of the brightest NICER observations, ObsID # 1050390115, on 2017 November 7. The black histogram and left-hand y-axis denote the folded pulse profile in the 0.2–12 keV band, averaged over the 7 MPU slices, after corrections for GTI exposure and deadtime have been applied. The green curve and right-hand y-axis denote the deadtime corrected exposure per phase bin, averaged over the 7 MPU slices for this observation. The total deadtime corrected exposure, averaged over MPU slices, for this observation is 1276.5 s. If the bin-to-bin variations were not present, each bin would have an exposure of 12.765 s. The exposure per bin differs for each observation and shows bin-to-bin variations >1% compared to uniform exposure for total count rates > 2000 counts s−1.

