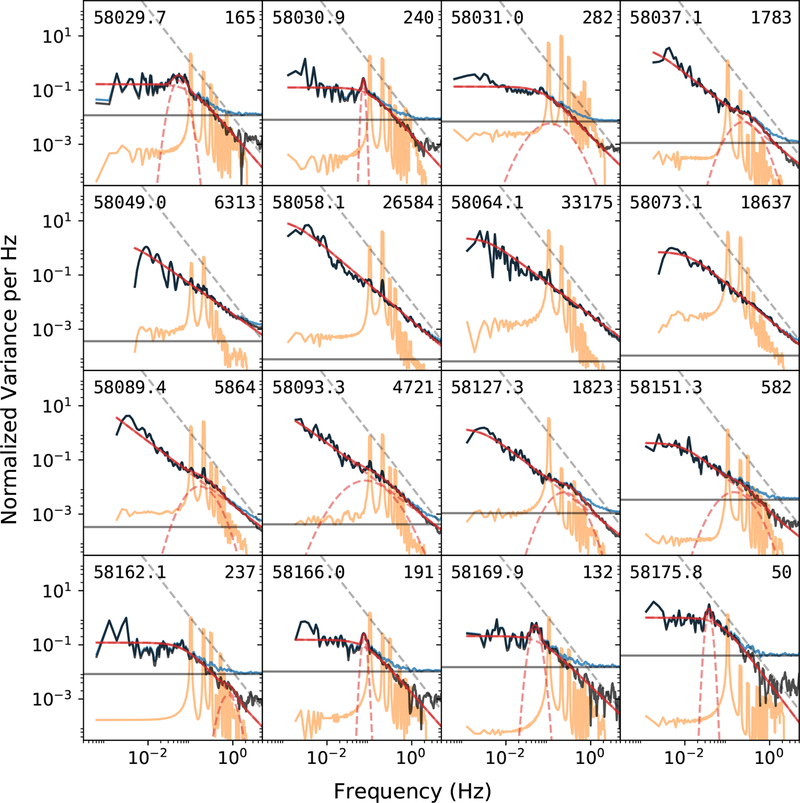
Figure 5.
The power spectral densities for 16 epochs with NICER. The MJD and count rate (from Table 1) are given for each observation. The main features are described in the text, and are briefly: light tan, estimated pulsed PSD; blue, smoothed PSD; dark horizontal line, white noise level; black, smoothed and noise-subtracted PSD; red, total (solid) and component (dashed) fits; dashed gray line, a 1/f2 line for visual comparison.

