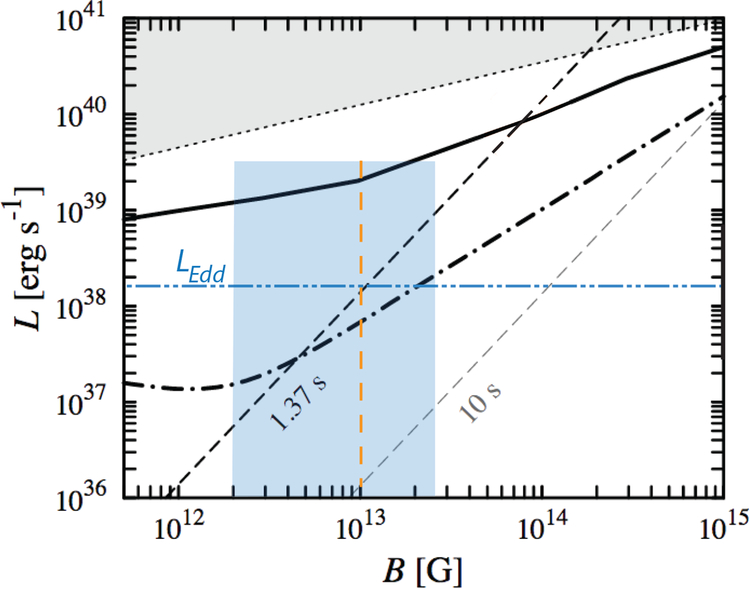
Figure 7.
Adapted from Mushtukov et al. (2015b). The solid black line represents the maximum luminosity for magnetized NSs as a function of magnetic field strength. The dotted line and shaded region above it indicates the upper limit where the spherization radius is smaller than the magnetospheric radius. Dashed lines represent the lower limit on the X-ray luminosity due to the propeller effect. The dash-dotted line represents the critical luminosity function. The range of observed luminosity for Swift J0243 (for a distance of 7 kpc) is indicated by an orange vertical dashed-line at the magnetic field value derived from the QPO, and the blue-grey shaded box indicates the estimated range of magnetic field values derived from the critical luminosity (see text Sect. 5.2 and 5.3). For comparison, Eddington luminosity (for a 1.4 M⊙ NS) is also indicated (long dash-double dotted horizontal turquoise line).

