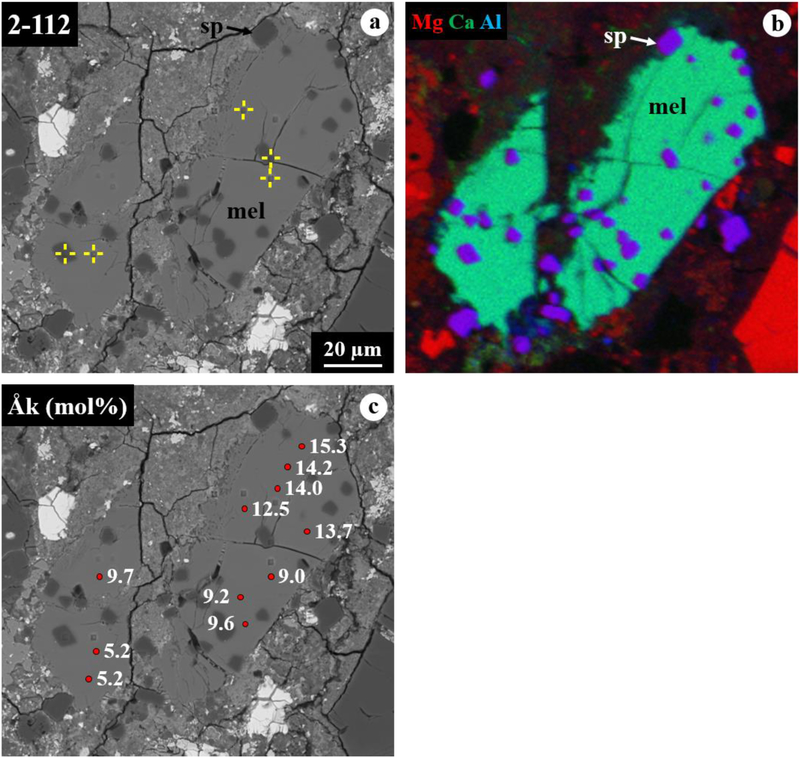
Figure 10.
BSE images (a, c) and combined x-ray map (b) in Mg Kα in red, Ca Kα in green, and Al Kα in blue of melilite-rich CAI 2–112 from ALHA77307. In (c), åkermanite contents are indicated with positions analyzed using electron microprobe. This CAI shows a poikilitic texture with euhedral to subhedral spinel grains enclosed in melilite, in which its åkermanite contents decrease gradually from one end of the crystals to the other. The ims-1290 ion microprobe spot is not appeared here.

