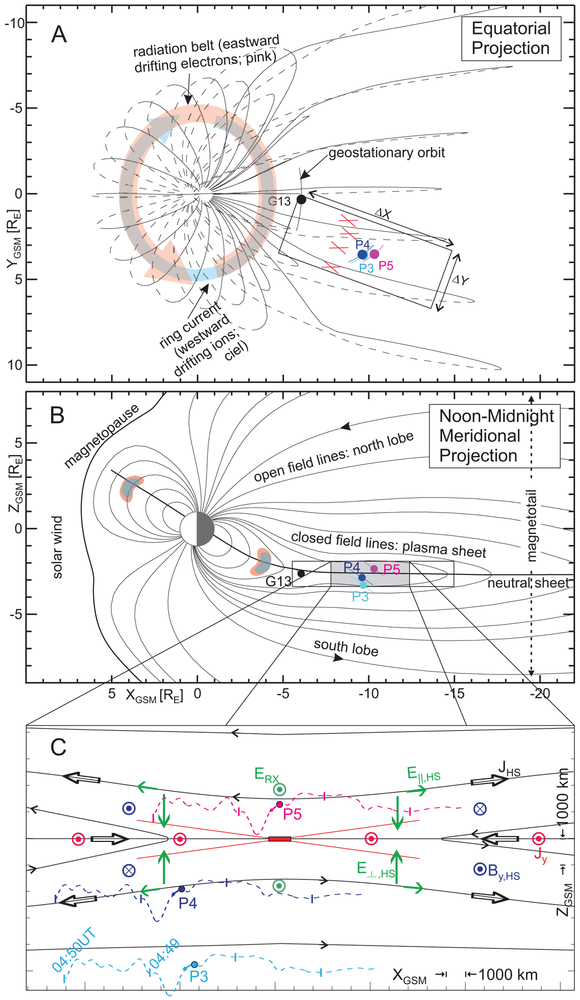
Figure 1 ∣. Magnetotail reconnection in Earth’s magnetosphere.
(A) and (B): Equatorial and meridional projections, respectively, of representative field lines from a storm-time magnetic model15 and satellites (orbit tracks at +/− 1hr) in Geocentric Solar Magnetospheric (GSM) coordinates (M2). In (A), solid lines: above magnetic equator; dashed: below; ΔX-ΔY rectangle: effective area of reconnection inflow region (for size estimate see text and M8), which could host multiple active reconnection sites (red X’s). In (B), magnetopause: envelope of magnetospheric field lines; neutral sheet: surface at which radial field reverses sign. (C) THEMIS P3, P4, and P5 satellites in context of magnetic topology of primary reconnection X-line at the time of its retreat tailward of P5; Hall system current (JHS, black arrows) and its magnetic perturbations (By,HS, blue arrowheads/tails); cross-tail current (Jy, red arrowheads); reconnection electric field (ERX, green arrowheads); and Hall system electric field (E⊥,HS, green equatorward arrows, E∥,HS, green field-aligned arrows). Red central rectangle: electron diffusion region of primary X-line. Dashed lines: (earthward) track of satellites relative to (tailward-) retreating reconnection topology, inferred from retreat speed (−75km/s) and current sheet location and thickness estimates (M6); tick-marks are placed at one minute intervals.

