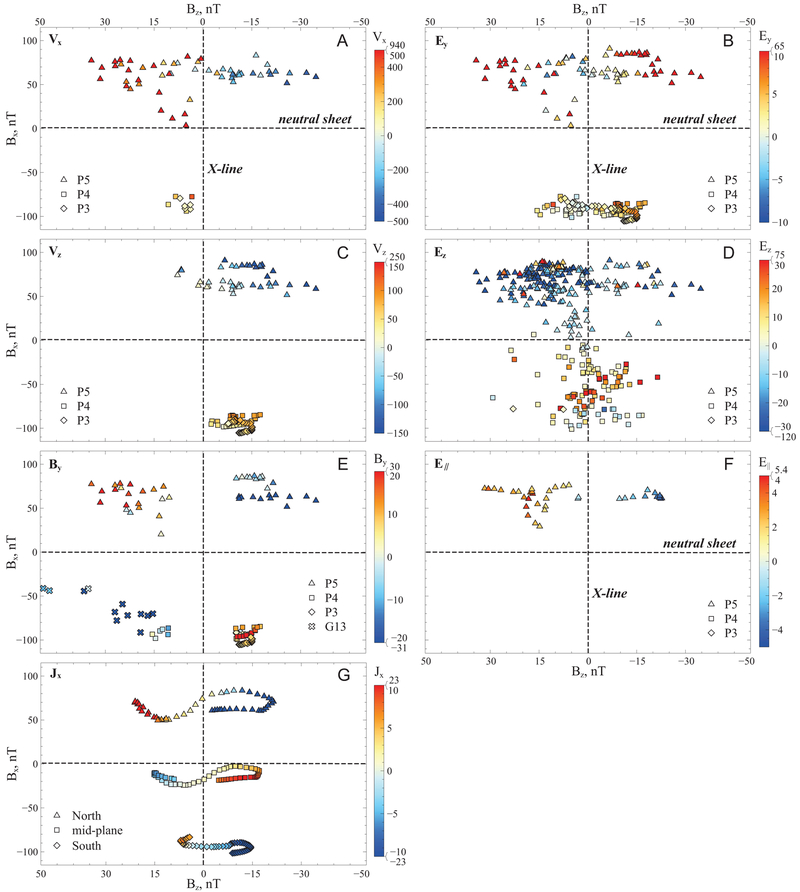
Figure 3. ∣. Observations in the context of reconnection geometry.
P3, P4, P5 and G13 data, in GSM coordinates for G13 or GSM coordinates rotated by ~10° about the ZGSM axis, to account for the approximate rotation of the field-line planes on THEMIS at that time (M2), obtained from the time period surrounding the X-line passage past THEMIS, plotted in Bz-Bx space. (Per reconnection geometry depicted in Fig. 1C, Bz positive/negative denotes the region earthward/tailward of X-line, respectively, while Bx positive/negative denotes the region above/below the neutral sheet, respectively.) Quantities plotted in color in each panel are: the X- and Y-directed ion velocity Vx, Vy in (A), and (C) respectively; the Y- and Z-directed measured electric field Ey, Ez in (B) and (D) respectively; the measured electric field parallel to the magnetic field E∥ in (F); the Y-directed magnetic field in (E) and the X-directed electrical current, Jx, in (G) inferred from magnetic field data (M7). Color scales for all panels are saturated to better depict the quantities plotted. A different representation of the same data (not color coded) showing the full range of the quantities and their correlation with Bx or Bz is in Extended Data Fig. 2. The time interval plotted is 04:46:30 to 04:50:00UT (vertical solid lines in Fig. 2) except for small deviations for Vz, By, and Ey, (C, E, and D), which are listed in the respective panels in Extended Data Fig. 2 (2C, 2E and 2F). To reduce clutter by random fluctuations, low magnitudes of quantities have been eliminated for Vx, By, Ez, and E∥, (A, E, D, and F, respectively) and those restrictions are also listed in the respective panels in Extended Data Fig. 2 (2A, 2E, 2F, and 2H).

