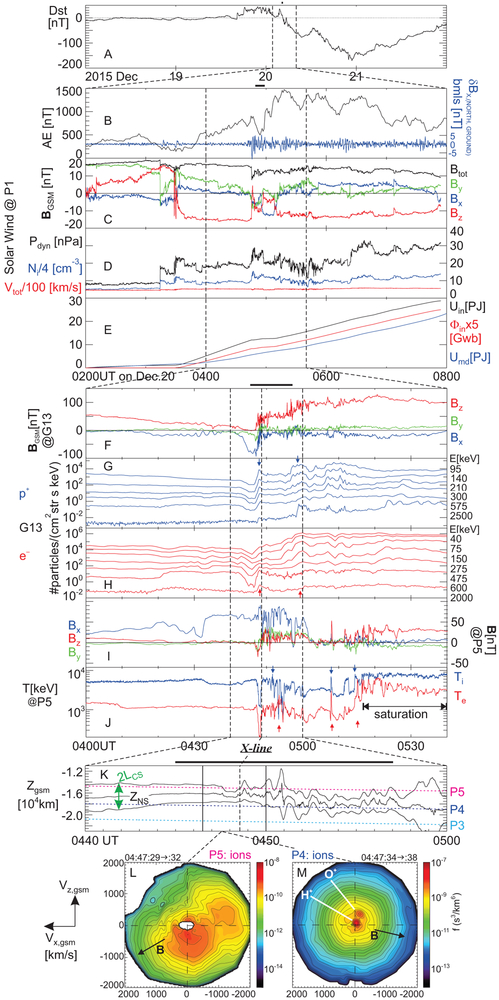
Extended Data Fig. 1. Extended overview of reconnection region observations.
(A) Dst index encompassing several days around the event. (B) AE index (black, left axis scale) and ground magnetometer magnetic pulsations from Bay Mills (bmls), band-pass filtered at 10s-120s (northward component δBX shown, in blue, in the right vertical axis scale; repeated from Fig. 2B for referencing the time of reconnection enhancement around the time of enhancement in pulsation amplitude). (C) Solar wind magnetic field at ARTEMIS P1 in GSM coordinates. In this and all subsequent panels showing vector quantities, black, blue, green and red traces correspond to the vector magnitude, and its X, Y, and Z components, respectively. Note that when not explicitly defined, X,Y, Z components refer to the GSM coordinate system rotated about the ZGSM axis by ~10° to account for the approximate rotation of the field-line planes on THEMIS at that time (M2). (D) Solar wind dynamic pressure, Pdyn (black); density, Ni (blue); velocity magnitude, Vtot (red) also at ARTEMIS P1, showing that the Pdyn increase was due to the Ni increase. (E) Cumulative integrals (M8) of: i) solar wind energy coupling function ε, Uin= ∫εdt (black); ii) flux input rate in the magnetotail by the solar wind electric field Ey,sw, Φin=0.2·40RE·∫Ey,swdt; and iii) magnetospheric energy dissipation rate computed from Dst and AE, Umd (blue).(F) G13 magnetic field components in GSM coordinates; (G) G13 proton fluxes at energies tabulated on the right (increasing flux corresponds to decreasing energy); vertical blue arrows show times of energization; (H) G13 electron fluxes corresponding to the energies tabulated to the right as in (G); vertical red arrows show times of energization; (I) P5 magnetic field components (shown for reference) in X, Y, Z rotated GSM coordinates; (J) ion (Ti) and electron (Te) temperatures at P5 (saturation noted after 05:16UT causes temperatures to be underestimated, but does not affect our conclusions (M4)); vertical blue and red arrows correspond to ion and electron heating, respectively. (K) Estimate of ZGSM location of the neutral sheet, ZNS (middle solid line), and current sheet thickness, LCS (represented by distances of the upper and lower solid lines from the middle one), obtained from Harris sheet model (M6), overplotted along with P3-P5 positions (colored dashed lines); vertical lines are same as in Fig. 2E-J; they correspond to the interval of interest (04:46:30 to 04:50:00UT) encompassing the fast flows (solid lines) and time of the X-line passage (04:48:30UT) by P5 and P4 (dashed line). (L) Representative ion velocity distribution function X-Z plane cut (X is positive to the left) during one spin near the peak tailward reconnection outflows at P5, showing simultaneous reconnection inflows from above the neutral sheet (M5). (M) Same as 1L but at P4, at approximately the same time, showing reconnection inflows from below the neutral sheet (M5).

