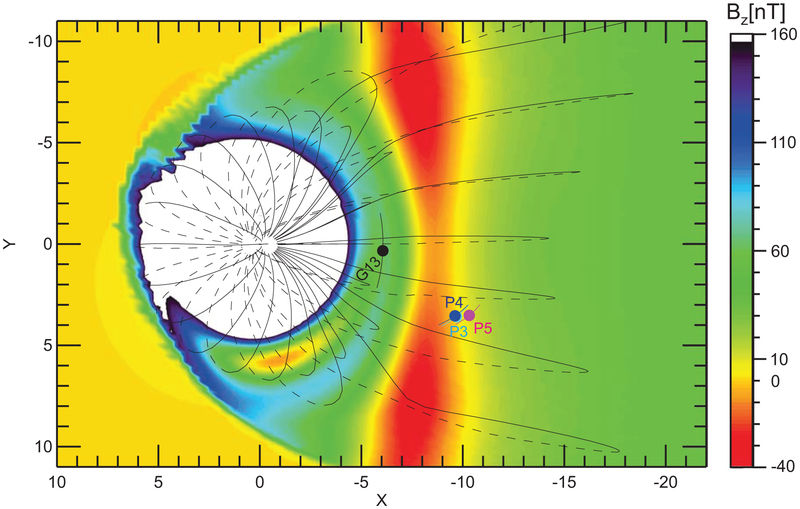
Extended Data Fig. 3. Model equatorial Bz.
Equatorial Bz profile (color) from the TS04 model15 based on solar wind and Dst values at 04:45UT, with field lines (solid lines: above magnetic equator; dashed: below) and satellite locations from Fig. 1 superimposed (for reference). The magnetic equator in the model was determined as the surface of reversals, as a function of Z. At the equatorial (X, Y) projections of THEMIS satellites, the model Bz ranges from −2.5 to −7nT.

