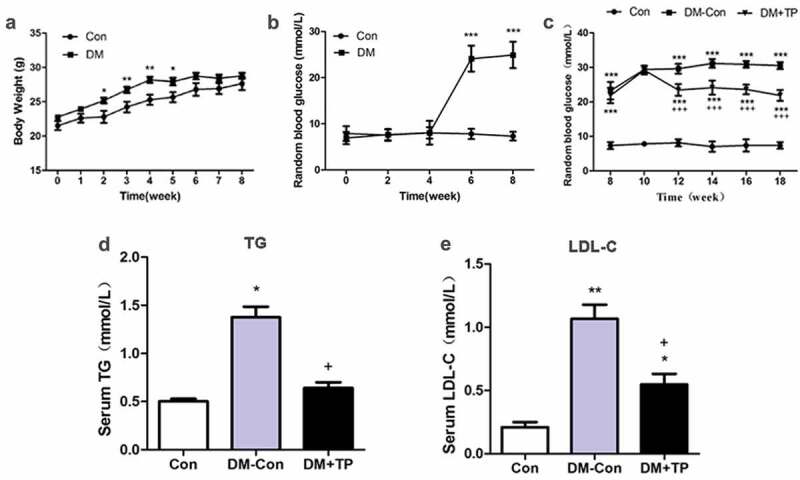
Figure 1.

The changes in body weight (a) and random blood glucose (b) during the generation of type 2 diabetic mice (n = 8-23/group). And the changes of RBG (c), serum TG (d) and LDL-C (e) in each groups after BAT transplantation (n = 5-8/group). *P < 0.05 vs Con; **P < 0.01 vs Con; ***P < 0.001 vs Con; +P < 0.05 vs DM-Con; +++P < 0.001 vs DM-Con
