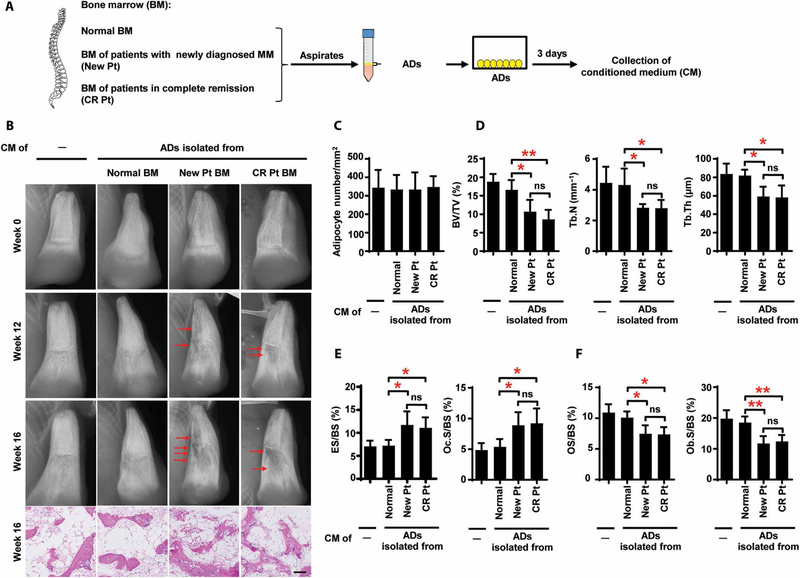
Fig. 2. Resorption of bone by marrow adipocytes isolated from patients with myeloma in vivo.
(A) Schematic for collection of the CM from cultures of adipocytes (ADs) isolated from BM. (B) Representative x-rays and images of H&E staining of bone chips from SCID-hu mice injected with the CM. Mice that received unconditioned medium served as controls. Red arrows, bone lesion. (C) Summarized quantification of adipocytes. Analysis of the bone chips using bone histomorphometry shows the percentages of BV/TV, Tb.N, and Tb.Th (D); the percentages of ES/BS and Oc.S/BS (E); and the percentages of OS/BS and Ob.S/BS (F). The data are averages ± SD (five mice per group, three replicate studies). *P < 0.05; **P < 0.01. P values were determined using one-way ANOVA.

