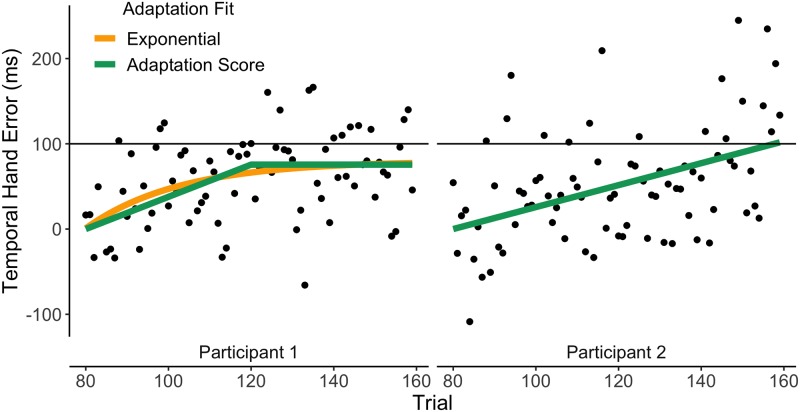
Fig 2. Adaptation score examples.
The dots represent the moving averages (window = 4 trials) of two example participants. In order to calculate the Adaptation Score, the slope (a) and asymptote (b) were normalized across subjects and then summed for each participant. For P1 we were able to fit an exponential function, while for P2 the adaptation an exponential could not be fit.

