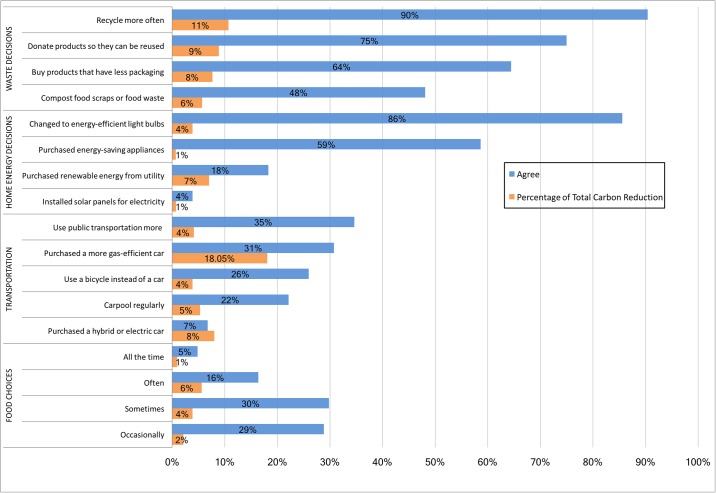
Fig 2. Survey results for questions related to how often participants make choices to reduce carbon emissions as a result of the COMM 168 course.
The blue bars represent the percentage of students who agreed with the survey response, while the orange bars represent the impact in carbon emissions in percent relative to the total reductions.

