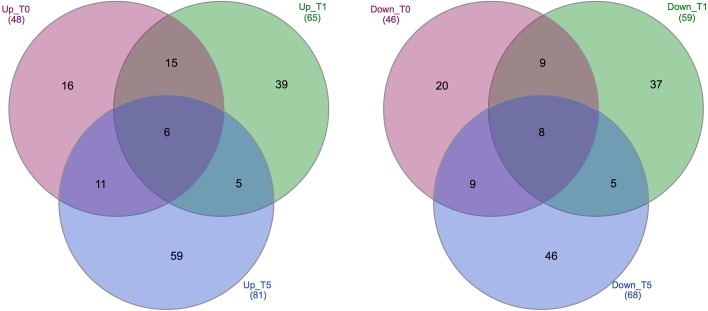
Fig 1. Venn diagram showing the number of specific and shared DEGs between pair time points in both cultivars.
Up_T0, genes up-regulated in resistant cultivar in comparison with susceptible cultivar at first time point. Down_T0, genes down-regulated in resistant cultivar or up-regulated in susceptible cultivar at first time point. T1 and T3 represent the second and third time points, respectively.

