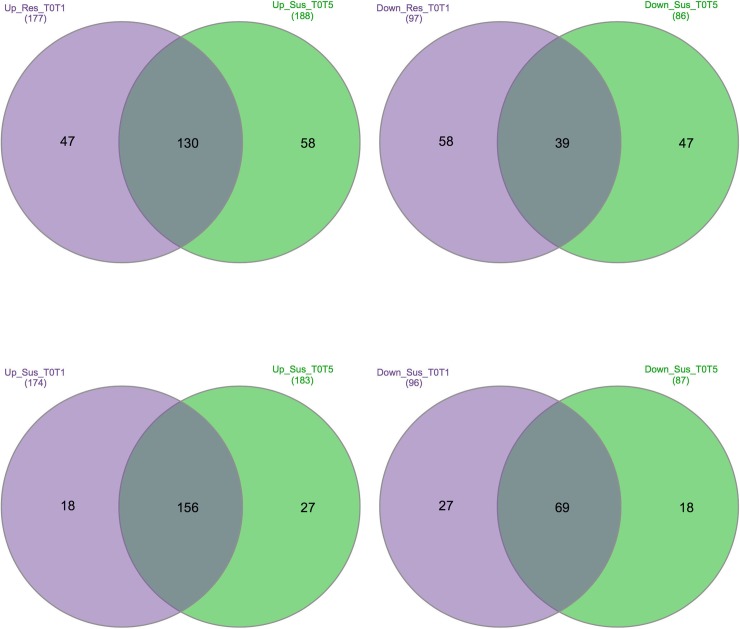
Fig 2. Venn diagram representing specific and shared up- and down-regulated genes between two sets in each cultivar.
Pink circle (first set) represents the comparison of first and second time points and green (second set) is the comparison of first and third time points. Up and Down represent up-regulated, down-regulated genes. Res and Sus represent resistant and susceptible cultivars.

