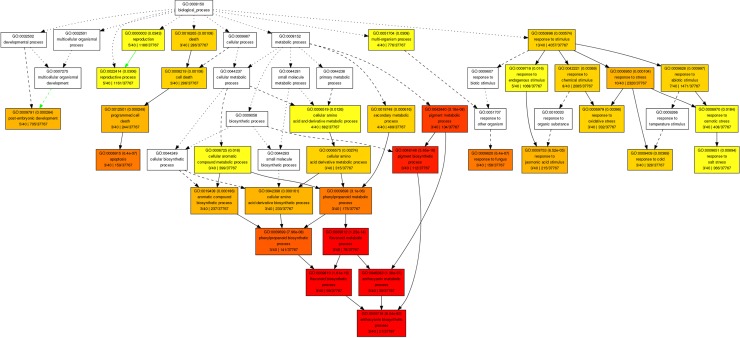
Fig 3. GO enrichment analysis for up-regulated genes in resistant cultivar as compared to susceptible cultivar at day 0 (control samples).
Boxes in the graph represent GO IDs, term definitions and statistical information. Significant GO terms (p ≤ 0.05) are marked with color. The degree of color saturation of a box is positively correlated to the enrichment level of the term.

