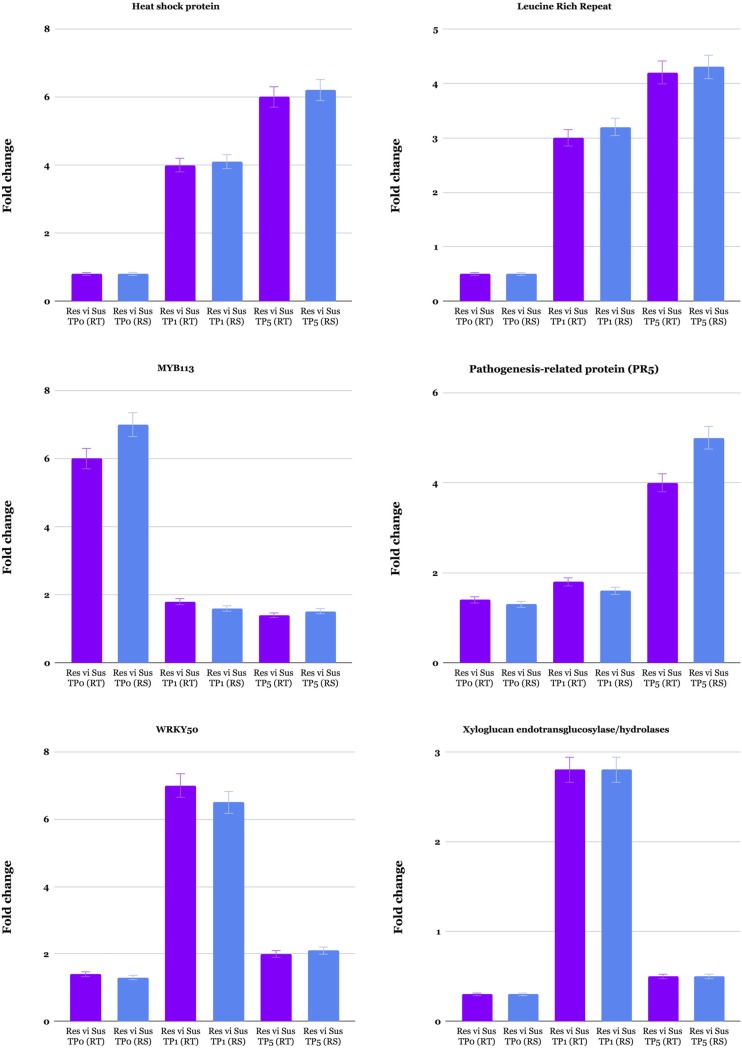
Fig 5. qRT-PCR results of genes selected from the RNA-Seq analysis of common bean–spider mite interaction.
Expression levels of tested genes were normalized based on of Actin gene and then compared to relative expression values determined by RNA-Seq. Relative expression values of samples were determined by using the average expression value of all replicates of a particular group. Standard deviation among replicates is represented by error bars. Res and Sus represent resistant and susceptible cultivars. TP0, TP1 and TP5 represent first, second and third time points. RT ans RS in parentheses represent qRT-PCR and RNA-Seq.

