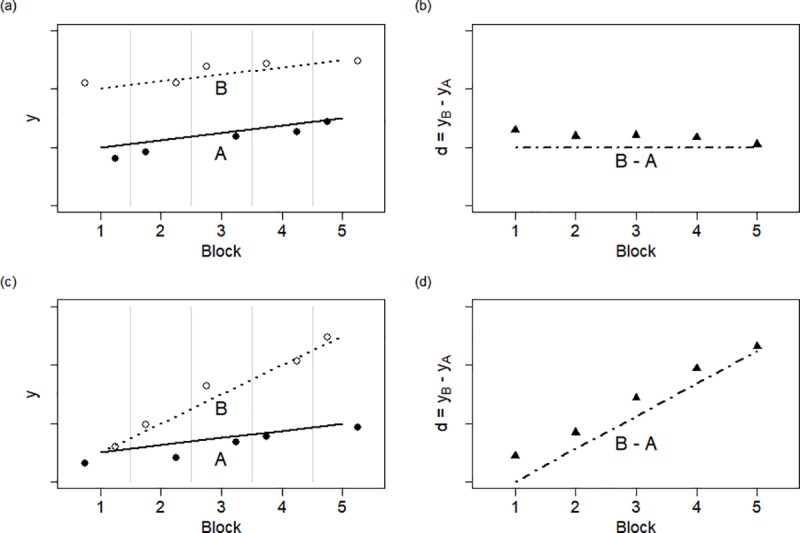
Fig 1.

These simulated data represent N-of-1 trials with m crossovers of treatments A and B, randomized within block (left panels). The differences between A and B within a block (right panels) may be suitably analyzed with paired serial t-tests for level-change (top panels) and for rate-change (bottom panels). The true means are represented with lines, and serially correlated observations with points.
