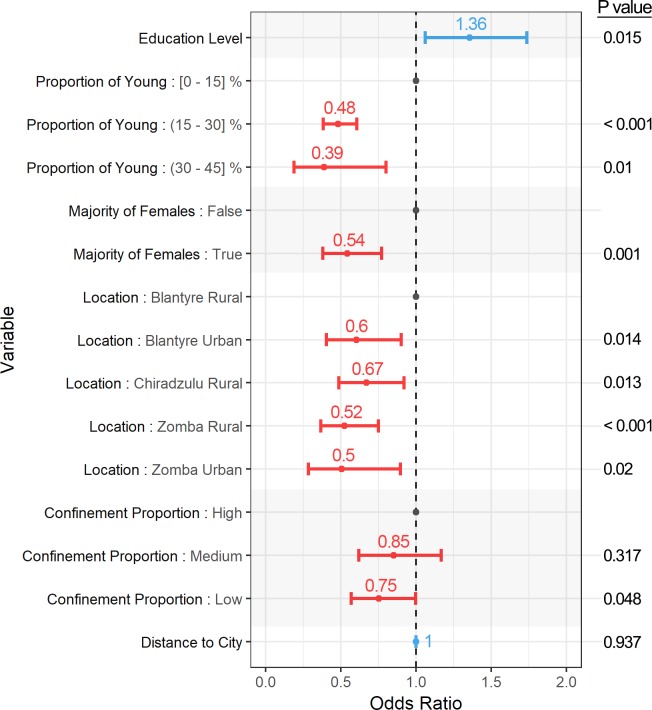
Fig 4. Graphical representation of the chosen regression model predicting absolute coverage (ACM).
The 95% CI is represented as horizontal bars. The value for the odds ratio is indicated above the 95% CI. A positive relationship between the variable and the response is coloured in red (odds ratio > 1.000), while a negative relationship is coloured in blue (odds ratio < 1.000). Baseline categories are coloured in grey. P values are shown on the left.

