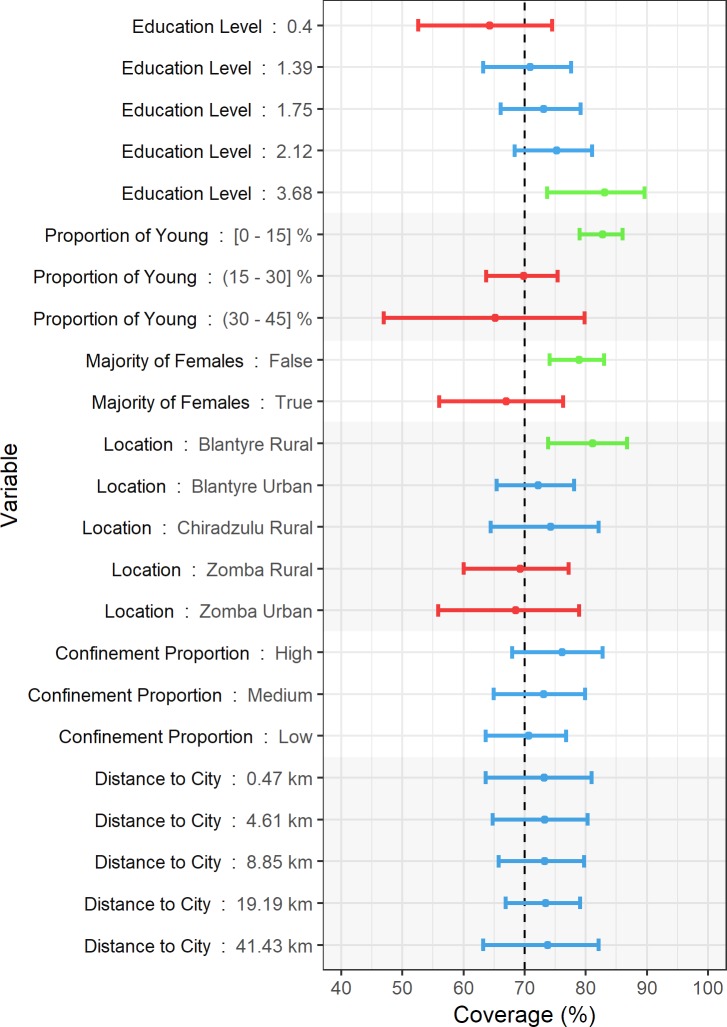
Fig 5. Graphical representation of the estimated marginal means analysis from the absolute coverage model (ACM).
The vertical bar represents the 70% vaccination coverage threshold. The 95% CI is represented as horizontal bars. Estimated coverages under 70% are coloured in red. Estimated coverages over 70% are coloured in blue. Estimated coverages whose lower 95% CI bound surpass 70% are coloured in green.

