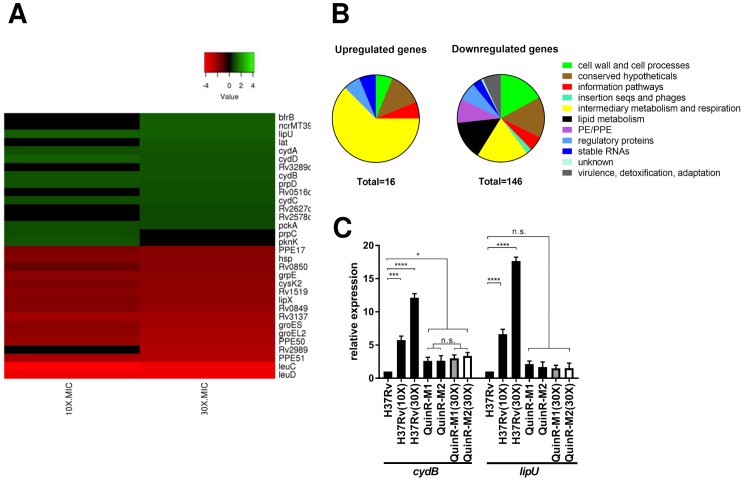
Fig 4. Transcriptome analysis of H37Rv exposed to 11626252.
(A) Heat map representing top significantly differentially regulated M. tb genes (Padj ≤ 0.05) after exposure of two independent cultures of M. tb H37Rv to 11626252 at 10X and 30X MIC for 4 h. The colour scale indicates differential regulation as log2 fold-change of H37Rv with 11626252 treatment relative to H37Rv with vehicle control, DMSO. Upregulation is indicated in red, downregulation is in green, and insignificant log2 fold change values for the condition are in black. Data are from two independent experiments. (B) Global transcriptome response and involvement of different metabolic responses, based on TubercuList classification (https://mycobrowser.epfl.ch/). (C) Fold-change expression of cydB and lipU determined by qRT-PCR. Bars in black, light grey and white represent the gene expression compared to H37Rv-DMSO, QuinR1-M1 in the presence of DMSO, and QuinR-M2 with DMSO, respectively. Data from two independent cultures are presented as the mean relative expression ± s.d. Statistical analysis was performed using two-way analysis of variance (ANOVA) with Tukey’s multiple-comparison tests (*, P <0.03; ****, P <0.0001).

