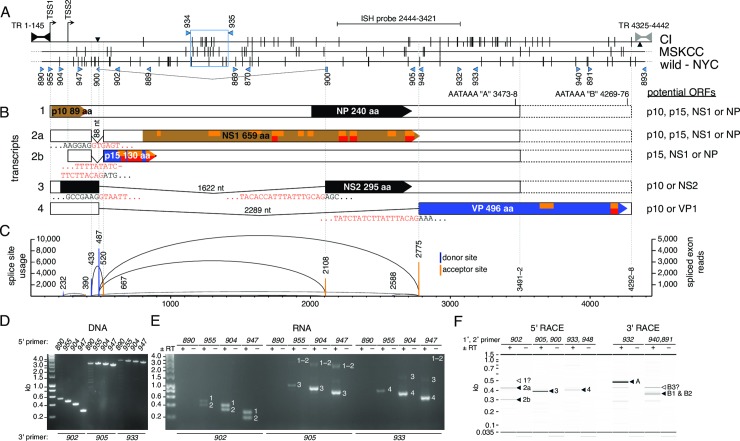
Fig 1. Map of the MKPV genome.
(A-B) Maps of the MKPV/MuCPV strains from Centenary Institute (CI, accession MH670587), Memorial Sloan Kettering Cancer Center (MSKCC, accession MH670588) and New York City basements (wild-NY, MF175078). “Bowties” indicate terminal repeats (TR). (A) Single nucleotide variations (SNV) between the CI, MSKCC and wild-NY accessions. Vertical lines—differences between accessions. Half height vertical lines—polymorphisms within an accession. ▼; 2 bp insertion in the CI strain. ▲; 1 bp insertion in a CI sub-strain. Dashed lines—missing extremities in MSKCC and wild-NY accessions, which consist of the exterior inverted repeats in the full-length CI sequence. (B-C) Alternative splicing allows production of the polypeptides p10, p15, NS1, NS2, NP and VP. Black, brown or blue shading indicate the relative reading frames of ORFs. p15, p10 and NP could theoretically be produced from multiple transcripts. Orange or red indicate peptides present in LC-MS/MS datasets PXD014938 (this paper) or PXD010540 [9], respectively. Exon or intron sequences flanking splice sites are shown in black or red text, respectively. (C) Quantitation of spliced MKPV reads in RNAseq data pooled from two MKPV-infected kidneys. Columns indicate splice site usage (left y-axis); heights of arcs (right y-axis) indicate the abundance of specific splice combinations. See S4 Table for more information. (D-E) Detection of spliced transcripts by RT-dependent PCR, using primers mapped in A-B. Input templates were MKPV-infected (D) kidney DNA or (E) DNAse/ExoI-treated kidney RNA, converted (+RT) or mock-converted (-RT) to cDNA. RT-PCR products corresponding to transcripts 1 to 4 are indicated by white numbers. (F) Mapping of transcription start and stop sites by RACE. See S1 Fig for RACE details. Major 5’ and 3’ RACE products, indicated by black arrows and corresponding to transcripts 2 to 4 or polyadenylation signals A and B, were gel-purified and Sanger sequenced. Other RACE products mentioned in the text are indicated by white arrows.

