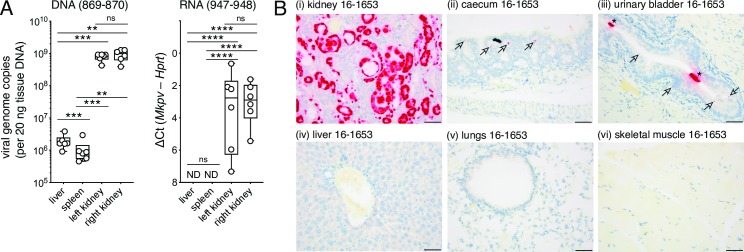
Fig 2. MKPV mRNA is kidney-restricted.
(A) Relative abundance by qPCR of MKPV genomes (left) or MKPV cap mRNA (right) in organs of naturally-infected Rag1–/–mice, using primers 869–870 or 947–948, respectively (Tukey’s box and whisker plots; n = 8). MKPV DNA is presented as viral genome copies. cap mRNA abundance is indicated by Ct relative to RT-qPCR for mouse Hprt mRNA. ND = not detected. Significance is indicated by asterisks (*, P<0.05; **, P<0.01, ***, P<0.001, ****, P<0.0001; ns, p>0.05; 1-way paired ANOVA with Tukey’s multiple comparisons test). (B) ISH for MKPV nucleic acids in necropsy specimens from NSG mouse 16–1653 housed in MSK-WCM in 2016. Scale bar = 25 μm. Arrows in panels (ii-iii) indicate mild multi-focal staining in caecum and urinary bladder; asterisks in panel (iii) indicate casts of necrotic tubular cells sloughed from the kidney into the urinary bladder lumen. Full details of ISH outcomes are listed in S5 Table.

