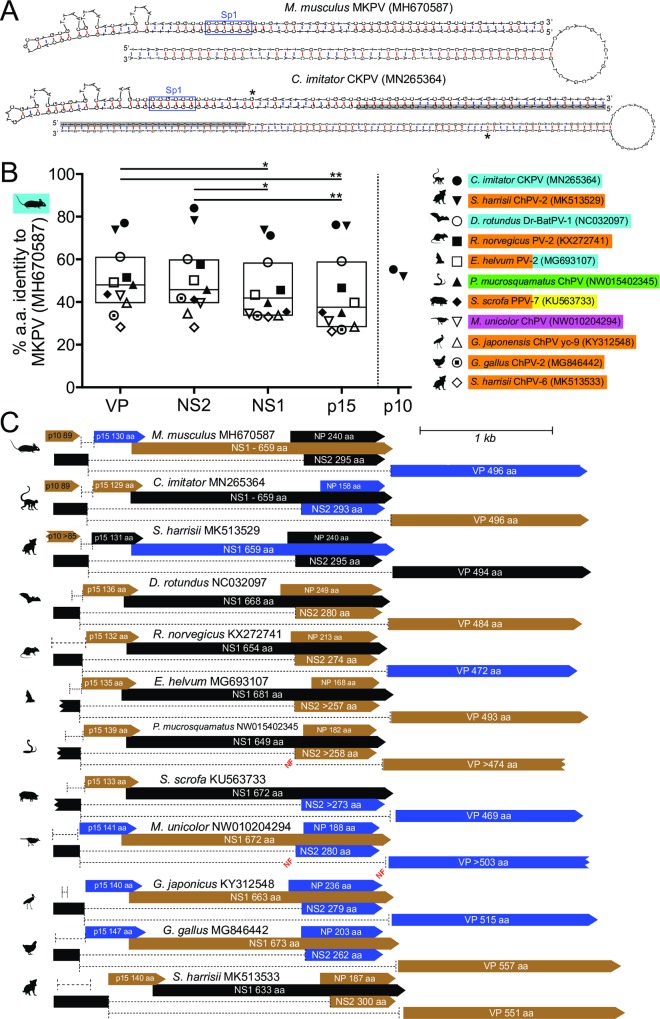
Fig 6. VP, NS1, NS2 and p15 ORFs, introns and TR structures of near-complete amniote ChPV genomes.
(A) The lowest Gibb’s energy structures predicted for the minus-strand TR regions of MKPV (MH670587) and CKPV (MN265364), with the left TR shown above the right TR. Sp1-binding sequences are boxed in blue. Grey shading in the CKPV TRs indicates sequence recovered from a solitary read, with the 3’-end of the solitary read indicated by “*”. (B) The percentage identity at the amino acid level between MKPV ORFs and the corresponding ORFs from nine other near-complete amniote chapparvoviral genomes currently available (MUSCLE alignment [35]). Tukey’s box and whiskers are used. Significant differences in relative ORF conservation (non-parametric Friedman test) are indicated as in the Fig 2 legend. Colours indicate tissue source(s) of the virus sequences: blue–kidney or urine, orange–faeces, yellow–lungs or respiratory tract, green–liver, pink–muscle. (C) Maps (same colours and symbols as in Fig 1B) of the near-complete amniote ChPV genomes analysed. Splice sites (or putative splice sites) are detailed in S5B Fig. Ragged ends indicate incomplete ORFs that continue beyond currently available sequence. Genomes sources are: [11, 14, 15, 36–39].

