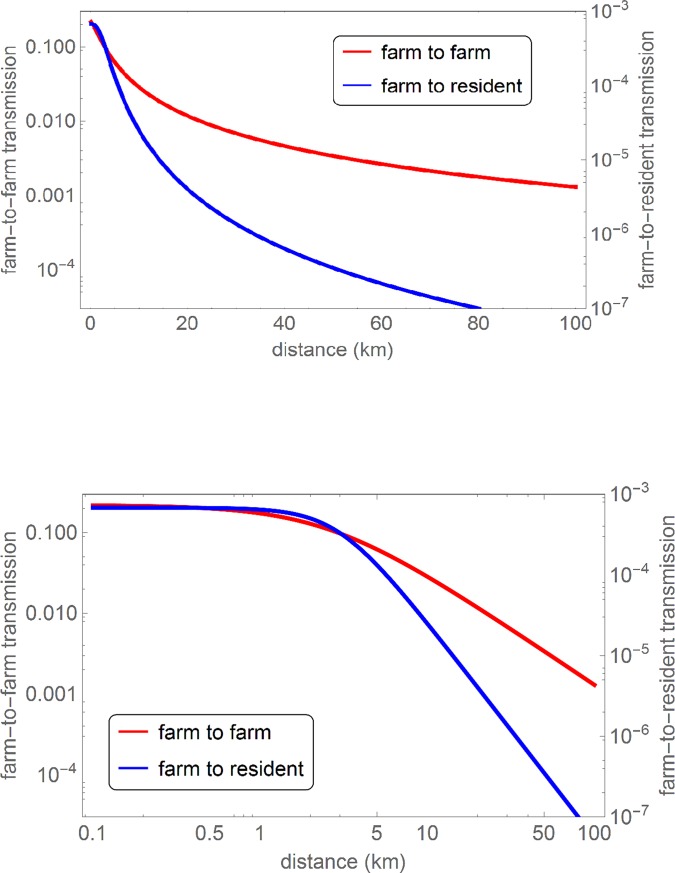
Fig 2.
The farm-to-farm and farm-to-resident Q fever transmission kernel as a function of the source-receptor distance, displayed on a log-log (upper panel) and log-linear (lower panel) scale. The smooth curves are obtained by plotting the analytical expression of the transmission kernel () for the parameters in Table 1.

