Fig. 2.

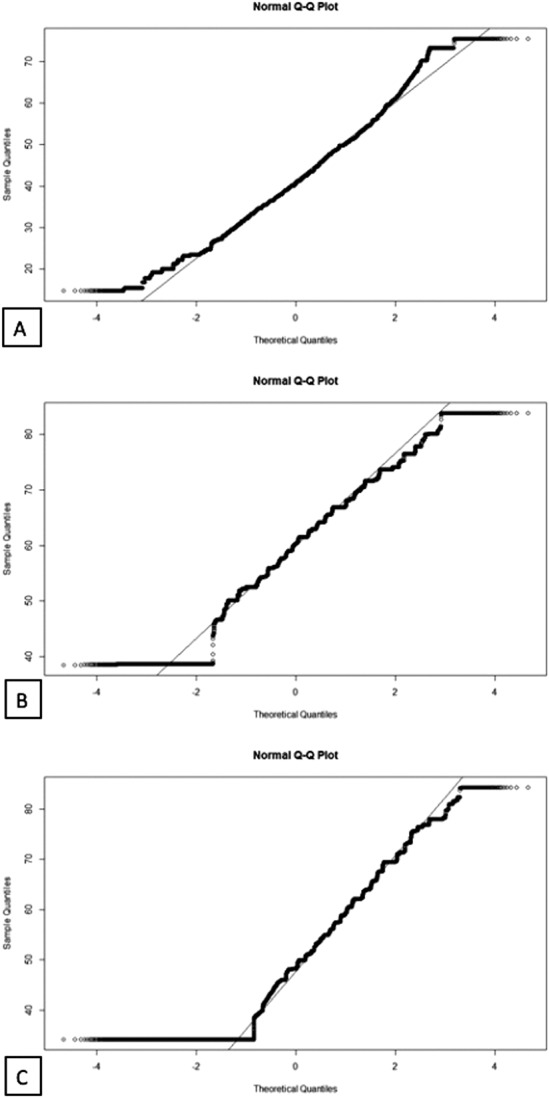
This figure shows (A) a Q-Q plot for the PROMIS PF, which demonstrates a normal distribution; (B) a Q-Q plot for the PROMIS PI, which has a ceiling effect; and (C) a Q-Q plot for the PROMIS Depression, which has a floor effect.

This figure shows (A) a Q-Q plot for the PROMIS PF, which demonstrates a normal distribution; (B) a Q-Q plot for the PROMIS PI, which has a ceiling effect; and (C) a Q-Q plot for the PROMIS Depression, which has a floor effect.