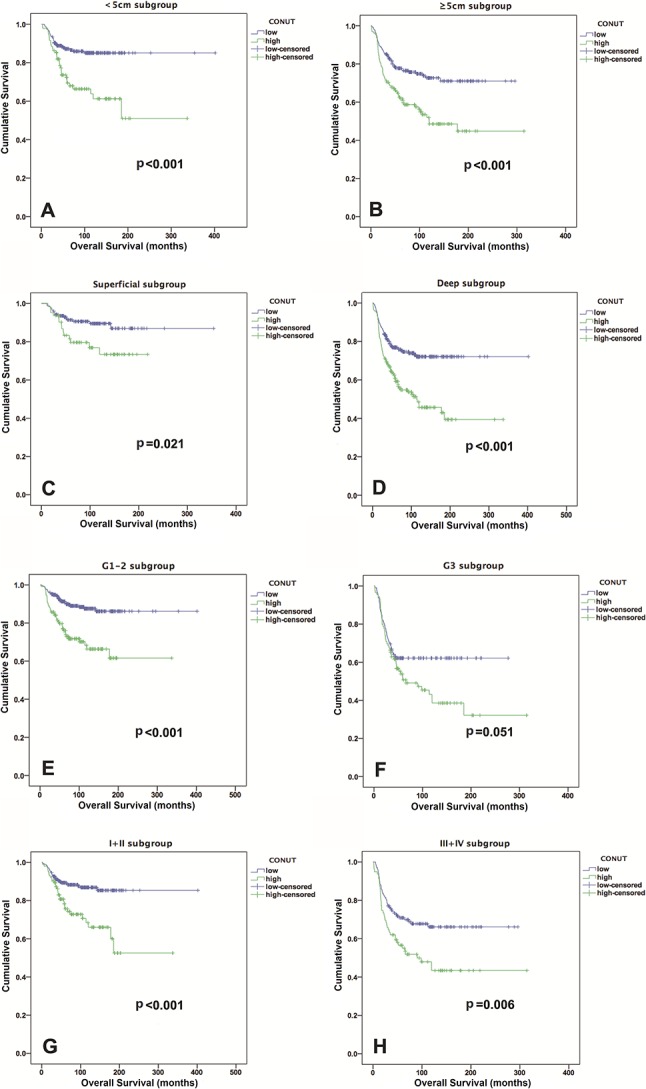
Fig. 3.

Kaplan-Meier curves show the OS based on the CONUT score in the (A) < 5 cm subgroup; (B) ≥ 5 cm subgroup; (C) superficial subgroup; (D) deep subgroup; (E) G1-2 subgroup; (F) G3 subgroup; (G) Stage I + II subgroup; and (H) Stage III + IV subgroup.
