
Fig. 1.
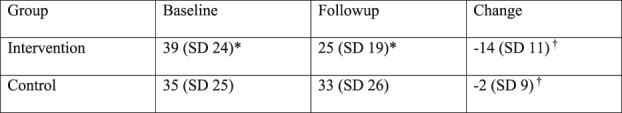
This figure shows the baseline, followup, and change in QuickDASH scores of the intervention and control groups. *indicates p < 0.05 between the baseline and followup scores within a group; †indicates p < 0.05 between the change in QuickDASH scores between groups.