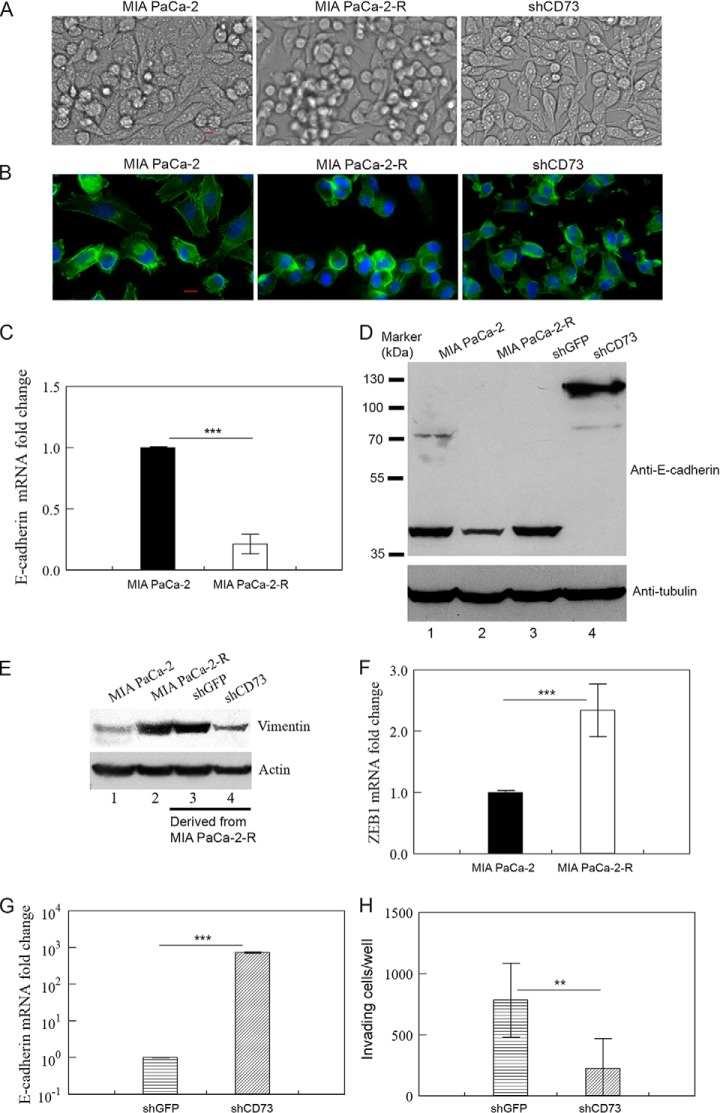
Fig. 8.
Role of CD73 in maintaining the radioresistant cells in a mesenchymal state. A, Morphology of the indicated cells. Images of live cells in culture were taken by Nikon Eclipse Ti2 Inverted Microscope. B, Staining of F-actin in the indicated cells with fluorescence-labeled phalloidin. The indicated cells in coverslips were fixed, stained with phalloidin-iFluor488 (green) and DAPI (blue), and images of the stained cells were acquired by Nikon Eclipse Ti2 Inverted Microscope. C, D and G, qRT-PCR (C and G) or Western blotting (D) analysis of E-cadherin mRNA/protein in the indicated cells. E, Western blot analysis of vimentin in the indicated cells. F, qRT-PCR analysis of ZEB1 mRNA in the indicated cells. H, Invasion assay for the indicated cells. Values in C, F, and G are the mean ± S.E. of three separate sample preparations. Values in H are the mean ± S.E. of six separate sample preparations. shCD73 and shGFP cells, see Fig. 5 legend. Tubulin and actin in D and E were loading controls. **p, < 0.01, and ***p, < 0.001. Note: Results in E were from the same Western blot analysis as shown in Fig. 6D; the same Western blotting membrane was stripped and reprobed with an anti-vimentin antibody.

