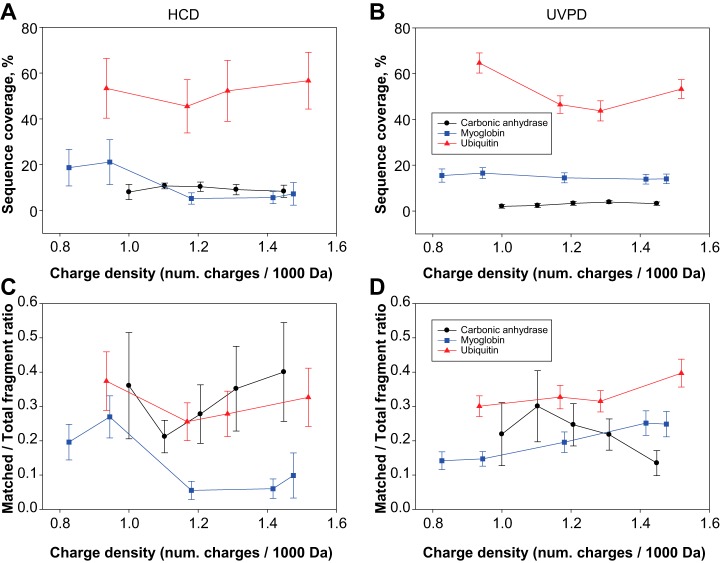
Fig. 2.
Sequence coverage and ratio of matched/total fragment ions as a function of charge state density of protein precursors in HCD and UVPD. The charge density is expressed as number of charges per kDa of protein average mass. Fig. 2A and 2B show the variation in sequence coverage for the three standard proteins for HCD and UVPD, respectively. Fig. 2C and 2D display the dependence of the fraction of matched ions over charge state density for HCD and UVPD, respectively. In these plots, all the applied NCE values (for HCD) or number of laser pulses (for UVPD) are averaged together. Error bars correspond to standard deviation.

