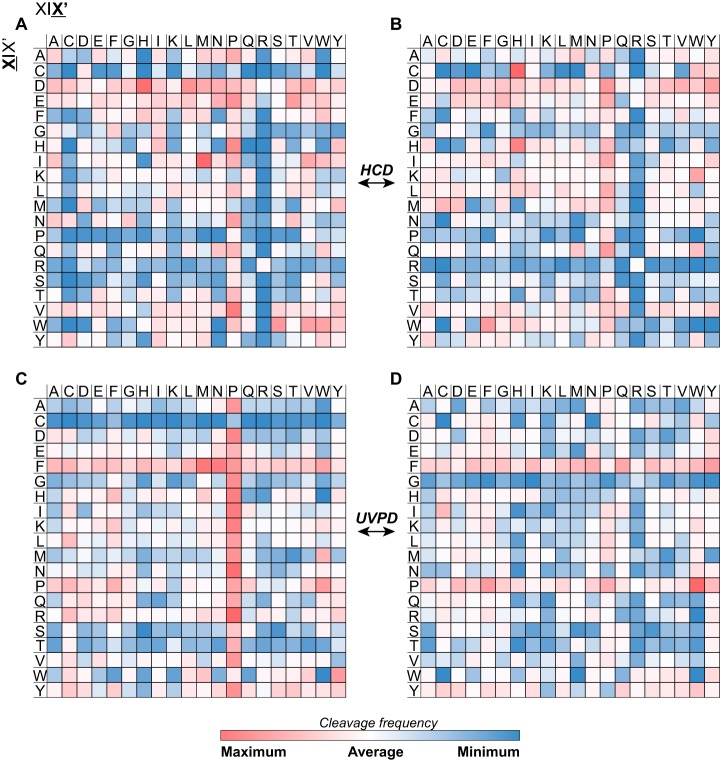
Fig. 7.
Heatmap of fragmentation propensities for HCD and UVPD. Matched backbone cleavages are indicated by residue pairs. For all panels, X X′ (columns) refers to fragmentation occurring C-terminal to the amino acid residue, whereas X X′ (rows) refers to fragmentation occurring N-terminal to the amino acid residue. A and B, display propensities for matched b- and y-ions generated by HCD, respectively. C and D, display propensities for matched a+- and x+-ions generated by UVPD, respectively The H. sapiens data set was considered to generate the heatmaps. White color indicates average cleavage frequency.

