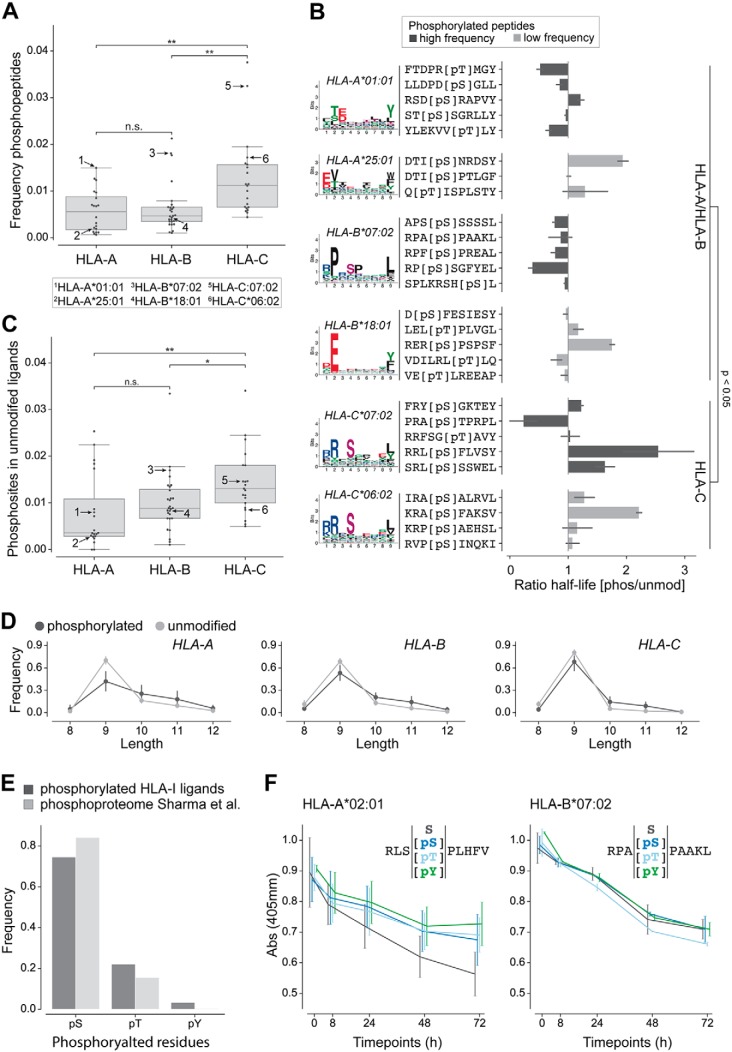
Fig. 2.
Analysis of phosphorylated peptides across HLA-I alleles. A, Frequency of phosphorylated peptides per HLA-A, -B, and -C alleles for peptides of any length. Numbers in the plot indicate alleles tested in panel B. B, Ratio of half-lives between the phosphorylated (pS/pT) and the unmodified (S/T) peptides for several alleles. The colors of the bars correspond to alleles with high and low frequency of phosphorylated peptides in A. For HLA-A*01:01, HLA-B*07:02, HLA-C*06:02 and HLA-C*07:02 phosphorylated HLA-I binding motifs are shown, for HLA-A*25:01 and HLA-B*18:01 binding motifs of unmodified HLA-I ligands are given because too few phosphorylated peptides were observed in MS data for these alleles. C, Fraction of unmodified HLA-I 9-mer ligands containing a phosphosite at P4 for HLA-A, -B, and -C alleles. Arrows indicate the same alleles as in panel A. D, Length distribution of phosphorylated and unmodified ligands of HLA-A, HLA-B, and HLA-C alleles. E, Frequency of the different phosphorylated residues within phosphorylated HLA-I ligands of length 8 to 12 and within the human phosphoproteome (47). F, Dissociation assay (absorbance from ELISA) for unmodified and phosphorylated peptides (with phosphorylated serine, phosphorylated threonine, and phosphorylated tyrosine). (*, p ≤ 0.05; **, p ≤ 0.01.)

