
Fig. 5.
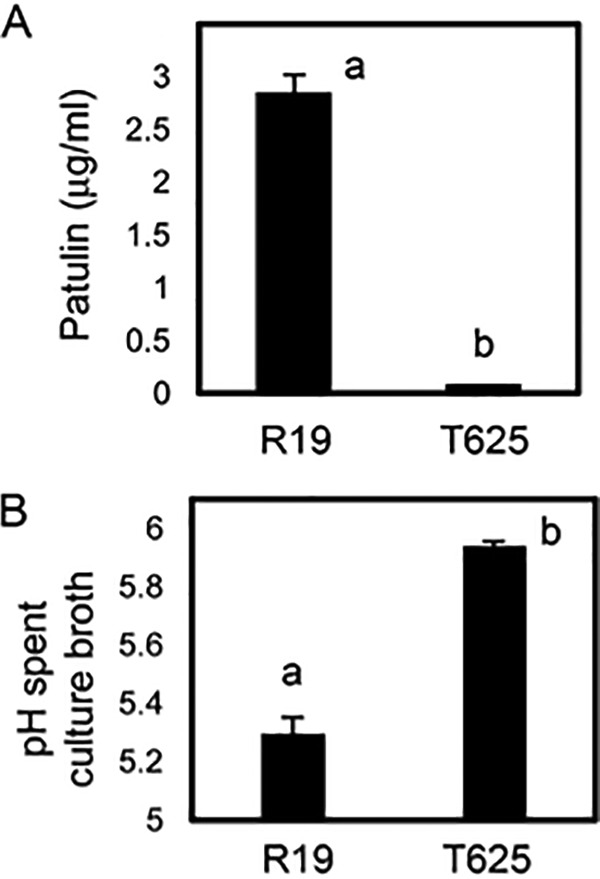
Amount of patulin and pH of spent growth broth for R19 and transformant T625. A, Mean patulin amounts as determined by HPLC. B, Mean spent broth pH. Treatments with different letters are statistically different following ANOVA and Tukey's HSD test and error bars represent standard deviation.