Fig. 6-A Fig. 6-B Fig. 6-C.
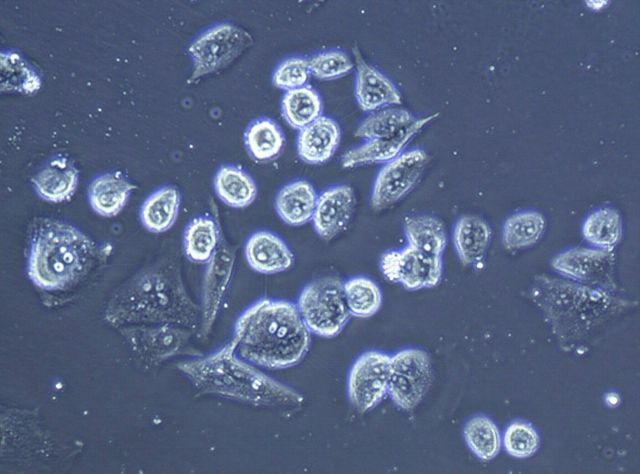
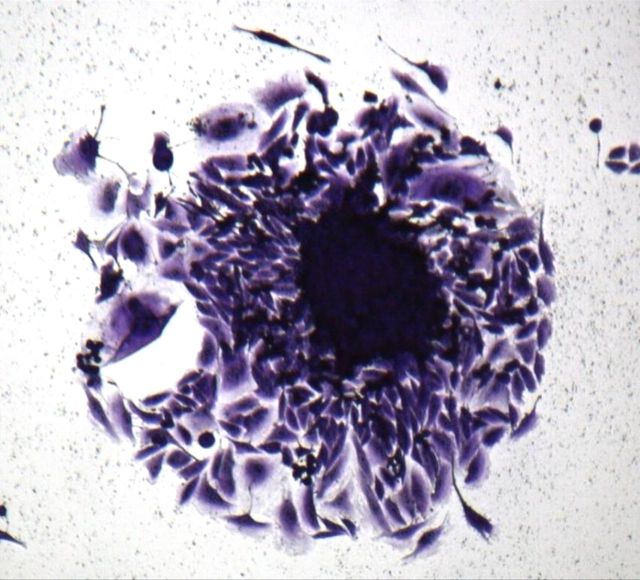
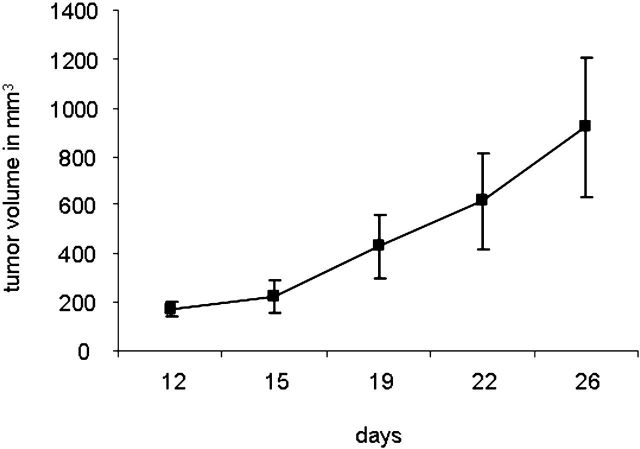
Fig. 6-A The left panel shows the morphology of EACH-1 cells (×200), and the right panel shows formation of a colony from soft agar assay (×100). Fig. 6-B The clonogenicity score after six and twelve days of culture in suspension. The errors bars represent the standard deviation. Fig. 6-C Tumor growth curve after subcutaneous injection of ten million EACH-1 cells in three nu/nu mice. The error bars represent the standard deviation.


