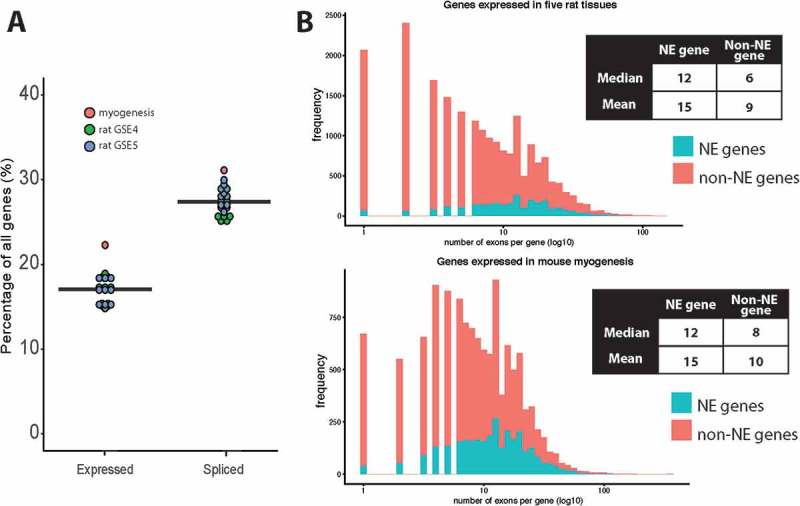
Figure 1.

Enrichment of alternatively spliced variants in NE genes. (a) The proportion of expressed genes whose protein products are found at the NE was compared to the proportion of spliced genes encoding a NE protein. Each dot represents a comparison between two tissues or developmental stages, for example muscle vs. liver or myoblast vs. myotube. To determine expressed genes the union of all genes considered to be expressed in both conditions was taken. Whether a gene was expressed was determined in two different ways (described in the methods), but here just the variance stabilizing transformation (VST) method is shown as it gave a more conservative estimate. To determine spliced genes, all genes that contained a differential splicing event with E(dPSI) ≥ 0.2 between the two conditions were taken, as calculated with MAJIQ. (b) The maximum exon number per gene was compared for NE genes vs. non-NE genes and it was found that NE genes have more exons on average than other expressed genes in myogenesis and five rat tissues. Note that only genes expressed in either mouse myogenesis or in the five rat tissues studied were considered, as otherwise the plots were skewed towards genes with very low exon numbers.
