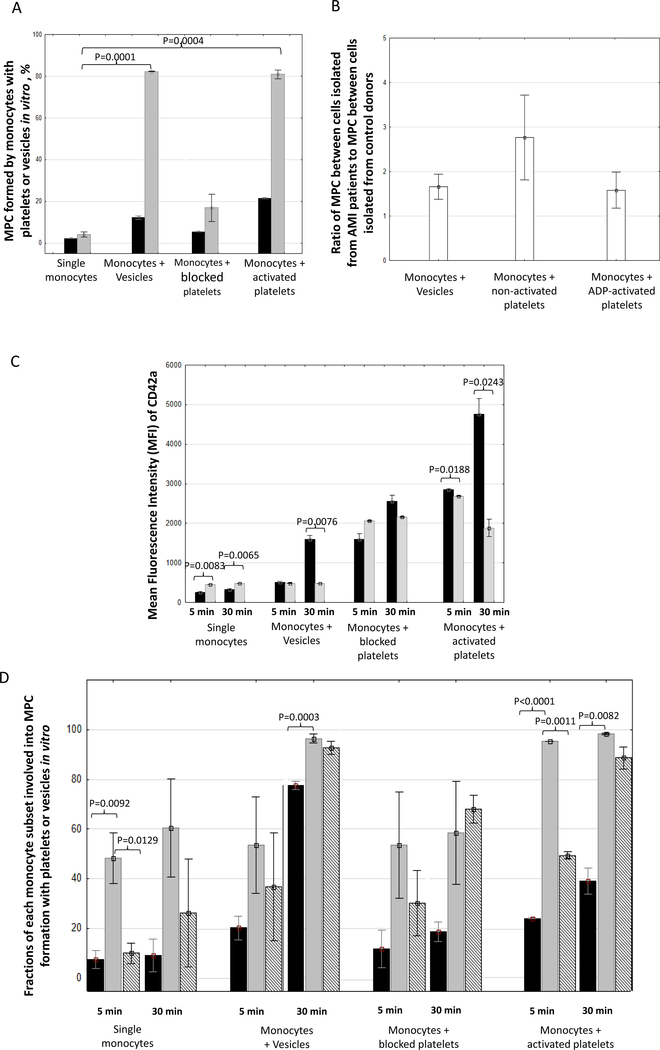
Figure 5. MPC formed in vitro by isolated monocytes with isolated platelet-derived EV or isolated platelets.
A. Fraction of MPC formed 5 (black) and 30 (grey) min in the course of incubation of monocytes with EV, with platelets blocked with PGE-1 or activated with ADP; B. CD42a MFI in all the events (grey bars) and specifically in MPC (black bars); C. Fractions of MPC formed between platelets or platelet-derived EV with each separate monocyte subset: classical (black), intermediate (grey), and non-classical (hatched). Data are represented as means ± SEM. Statistical differences were calculated as per Student’s t-test and were considered significant if the p value was below 0.05. The p value for all significant differences is indicated in the figure next to the corresponding columns.

