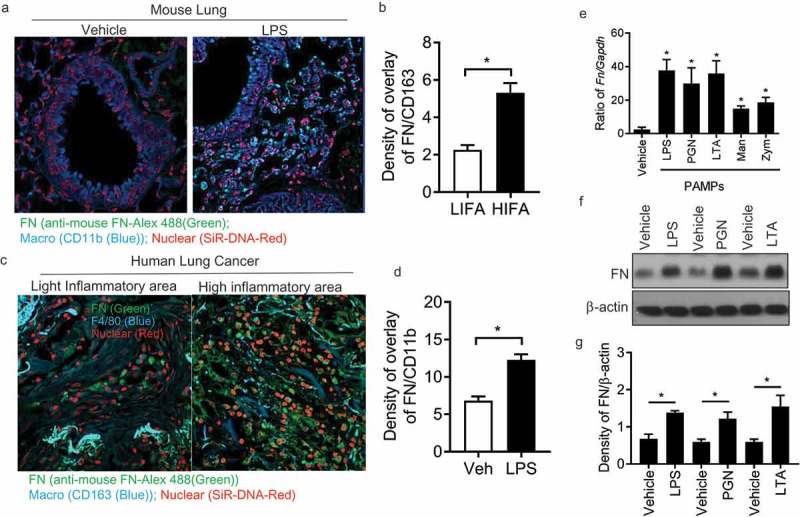
Figure 1.

Macrophages express FN during inflammatory responses. Mouse lung tissues after LPS treatment were stained with nuclear SiR-DNA-Red, anti-FN Ab-Alex 488 and Anti-CD11b-APC and observed with confocal microscopy (a) and quantification of FN expression in confocal images of LPS treated lung compared with vehicle-treated lung (b) (n = 11,*p < 0.05). Expression of FN in macrophages around human lung cancer (c) and quantification of FN expression in confocal images of LPS treated lung compared with vehicle-treated lung (d) (n = 11,*p < 0.05). Human lung cancer tissues were stained with SiR-DNA-Red, anti-FN Ab-Alex 488 and Anti-CD163-Violet 421 and observed with confocal microscopy (x 40); FN mRNA level of peritoneal macrophages was measured after PAMPs stimulation by q-PCR. (n = 5, *p < 0.05). Briefly, 1 × 10⁶ peritoneal macrophages/well (24 well culture plate) were cultured with LPS (1ug/ml), PGN (10 ug/ml), LTA (5 ug/ml), Mannan (5 ug/ml) and Zym (10 ug/ml) for 4 hours at 37oC. The cell samples were collected with Easy RNA kit and cDNAs were prepared by high-efficiency cDNA kit. FN was quantified by TaqMan real-time PCR system with Taqman FN probe (e); FN expression of peritoneal macrophages was analyzed by western blot After LPS, PGN, and LTA (f), and quantification of the western blot was completed with ImageJ software (g). (n = 3, *p < 0.05). Statistical comparisons among treatment groups were performed by randomized-design two-way ANOVA, followed by the Newman-Keuls post hoc test for more than two groups, or by unpaired Student’s t-test for two groups using Prism software (Graph Pad Inc., La Jolla, CA), as appropriate. Statistical significance was defined as a P value of less than 0.05.
