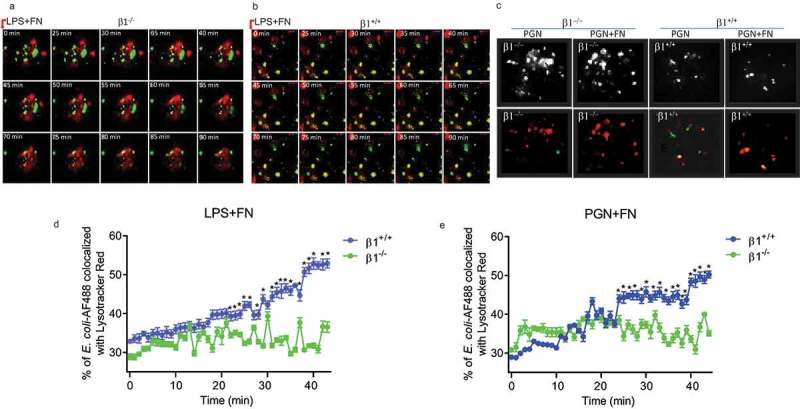
Figure 5.

FN has an impaired phagosome/lysosome fusion of macrophages in integrin β1-/- macrophages. Confocal images showing the colocalization of AF488-labeled E. coli with Lysotracker Red in integrin β1-/- macrophages (β1-/-) and integrin β1+/+ macrophages(β1+/+). To observe the effect of FN plus LPS in regulating phagosome/lysosome fusion of integrin β1+/+ (a) and integrin β1-/- (b) macrophages, Integrin β1+/+ and integrin β1-/- peritoneal macrophages pre-adhered to coverslips were preloaded with Lysotracker Red and incubated with opsonized AF488-E. coli at a ratio of 1:50 (cell/bacteria), and taken the images at 0, 25, 30, 35, 40, 45, 50, 55, 60, 65,70, 75, 80, 85 and 90 min at 37°C with LPS (1ug/ml) plus FN (1 ug/ml) by laser confocal microscopy. Since macrophage phagosomes are often formed at about 30 min after macrophage phagocytosis to bacteria, for the observation of FN plus PGN (c), the colocalization images of phagosome with lysosome were taken only at 30 min with PGN (1ug/ml) alone and PGN(1ug/ml) plus FN(1ug/ml) in integrin β1-/- macrophages and integrin β1+/+ macrophages (lower panel in C), and the colocalization white field images of phagosome with lysosome were also taken in the same time (upper panel in C). In addition, to determine the kinetics of phagosome maturation, the co-localization of AF488-labeled E. coli with Lysotracker Red was examined by laser confocal microscopy (LSM 710, Carl Zeiss) at every minute interval from starting the macrophages of integrin β1-/- or integrin β1+/+ mice mixed with FITC-conjugated E. coli and adding FN plus LPS (d) or FN plus PGN (e) up to 50 min. The percentage of E. coli -containing phagosomes that co-localized with Lysotracker (fluorescence overlay) was quantitatively analyzed using the co-localization dialogue of Metamorph software version 7.0 (Universal Imaging, a subsidiary of Molecular Devices) by randomly scanning > 10 cells in each test group in 3 independent experiments (d and e). (n = 3, *p < 0.05). Statistical comparisons among treatment groups were performed by randomized-design two-way ANOVA and followed by unpaired Student’s t-test for two groups using Prism software (Graph Pad Inc., La Jolla, CA). Statistical significance was defined as a P value of less than 0.05.
