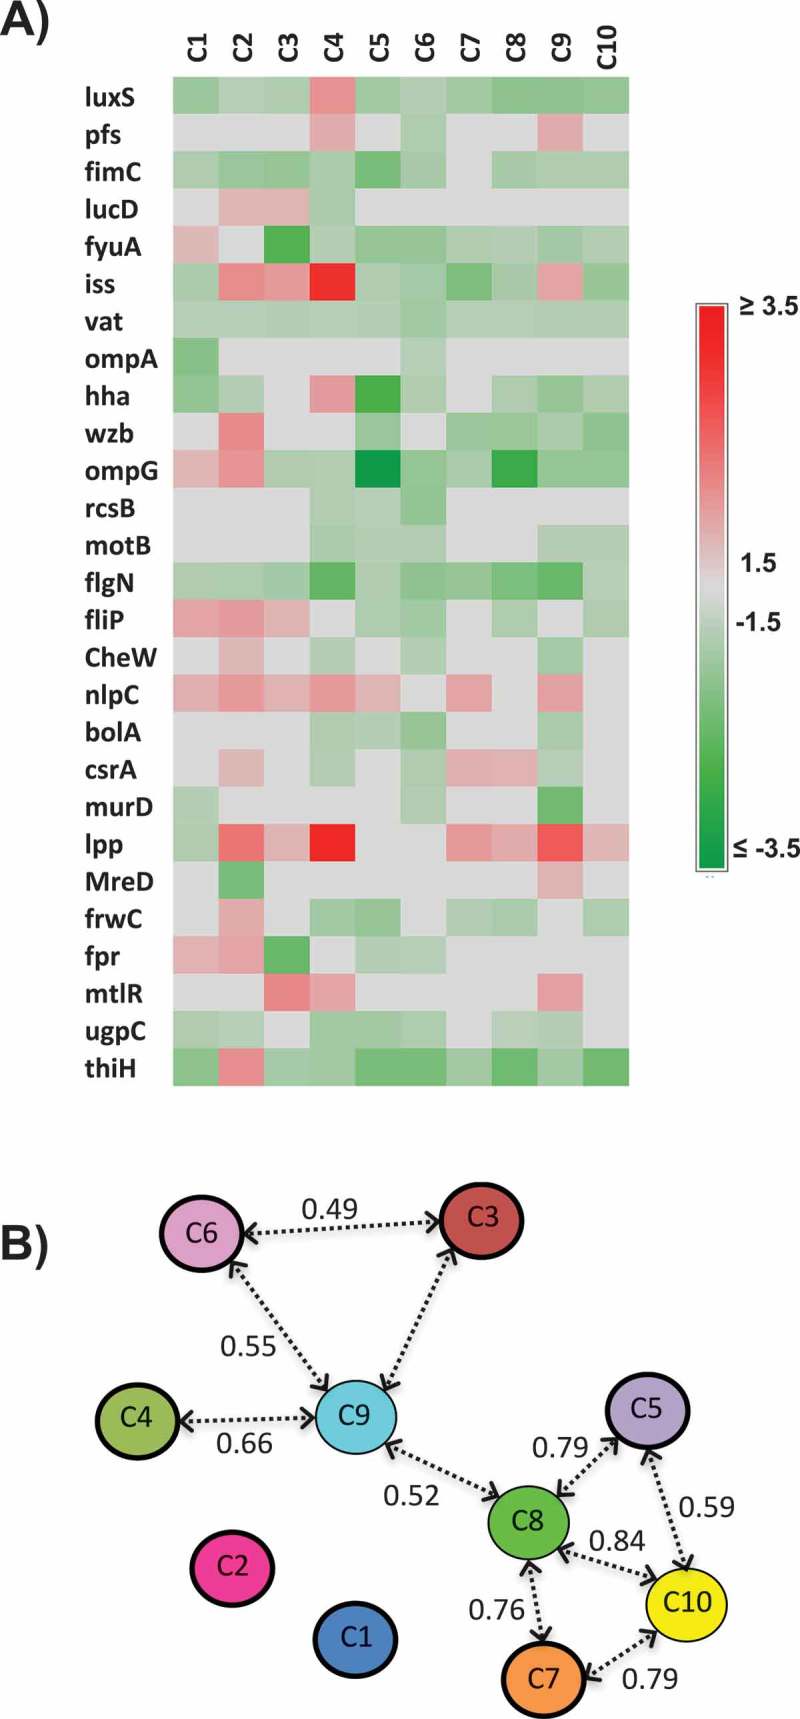
Figure 6.

Effect of the AI-2 inhibitors on expression of QS and virulence-associated genes; A) Heat map showing the impact of the selected AI-2 inhibitors on gene expression of QS and virulence associated genes. Effect on gene expression was assessed using 100 µM of AI-2 inhibitors. Three independent experiments were conducted and the average fold change was calculated using ∆∆ct. Fold changes ± 1.5 ≥ or ≤ 1.5 were considered differentially expressed. B) Principal component analysis (PCA) of the qRT-PCR data. Numbers above the arrows indicate the correlation (r) between the AI-2 inhibitors based on the gene expression data. The PCA analysis is based on the fold change of gene expression data.
