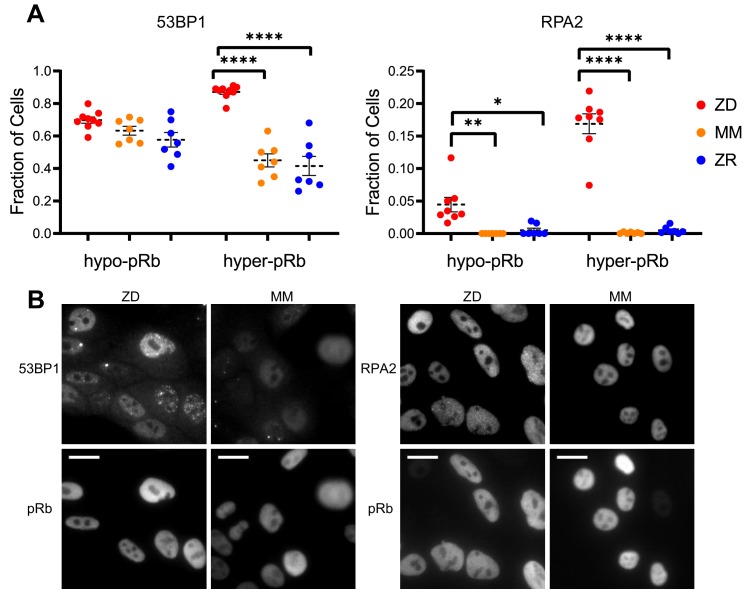
Figure 5. Zn2+ deficiency leads to increased DNA damage.
(A) Cells were grown in ZD, MM, or ZR media for 24 hr and then stained with antibodies for pRb and either 53BP1 (a marker of DSB) or RPA2 (a marker of SSB). The pRb status of each cell was used to classify cells as either quiescent (hypo-pRb) or cycling (hyper-pRb). Foci were identified using a custom MATLAB script. The fraction of cells positive for DNA damage (presence of 1+ foci) is plotted. Each point represents an individual well from two pooled biological replicate experiments (n wells = 6–9 per condition).The total n values for each condition are as follows: 53BP1: 5940, 6069, and 7473 for ZD, MM, and ZR; RPA2: 4454, 5991, and 6480 for ZD, MM, and ZR. Statistical significance was assessed using one-way ANOVA with Sidak’s multiple corrections test (*p<0.05, **p<0.01, ****p<0.0001). Exact p-values for 53BP1: hyper-ZD vs hyper-MM = 5.54E-10, hyper-ZD vs hyper-ZR = 6.61E-11; Exact p-values for RPA2: hypo-ZD vs hypo-MM = 4.17E-03; hypo-ZD vs hypo-ZR = 1.35E-02, hyper-ZD vs hyper-MM = 1.00E-15, hyper-ZD vs hyper-ZR = 3.00E-15. (B) Representative images for 53BP1 and RPA2 staining for ZD and MM conditions. Scale bars indicate 20 µm.

