
Author response image 1. Different read cut-offs do not alter clustering pattern, while altering number of included cells.
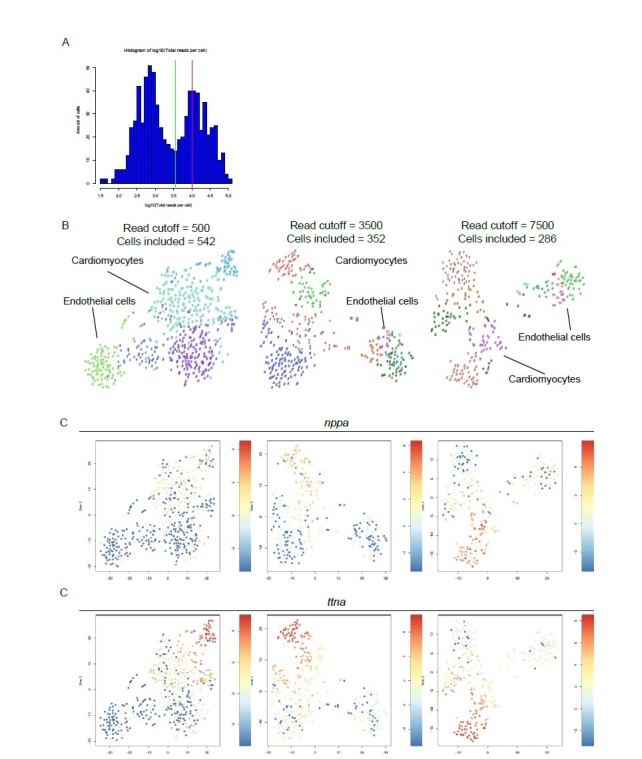
(A) Distribution of reads per cell. Green line represents 3,500 reads, red line indicates the mean number of reads per cell (10,443). (B) tSNE maps generated with different read cutoffs. Read cutoffs and included number of cells are indicated on top of tSNE maps. (C) Expression of two marker genes of dedifferentiated cardiomyocytes: nppa and ttna.