. 2020 Feb 4;9:e49416. doi: 10.7554/eLife.49416

Figure 1. cAMP signaling switches cDC2s to a pro-Th17 bias.

(A–D) IL-4, IL-17A, IFN-γ and IL-10 levels from anti-CD3/28 Ab-stimulated OT-II cells co-cultured with WT splenic cDC2s (CD11c+CD11b+CD8α-) pretreated with or without CPT. (E) qPCR analysis of lineage commitment factors in OT-II T cells co-cultured with WT cDC2s in the presence of CPT. (F) GFP expression from IL-17GFP OT-II CD4+ T cells co-cultured with WT cDC2s pretreated with or without CPT. (G) qPCR of TFs in WT cDC2s treated with CPT (50 μM). Two-way ANOVA with Sidak’s multiple comparisons test; n = 3 in each group, **p<0.01, ***p<0.001. Effect of CPT treatment; Irf4 (p=0.002), Klf4 (p<0.001) and Crem (p<0.001). (H) Intracellular staining of IRF4 in WT cDC1 and cDC2s treated with or without CPT for 48 hr. (I–M) Fate mapping: IL-17GFP OT-II CD4+ T cells were co-cultured with GnasΔCD11c BM-APCs to generate memory Th2 cells (1st co-culture). From the 1st co-culture, T1/ST2+ cells were FACS sorted and then used for co-culture with WT cDC2s pretreated with or without CPT or Cholera toxin (CT) (2nd co-culture). (I) IL-4, (J) IL-17A and (K) IFN-γ levels, (L) qPCR of lineage commitment factors, and (M) GFP signal for IL-17 expression in the re-stimulated CD4+ T cells from 2nd co-culture. Data are representative of three independent experiments; *p<0.05, **p<0.01, ***p<0.001.

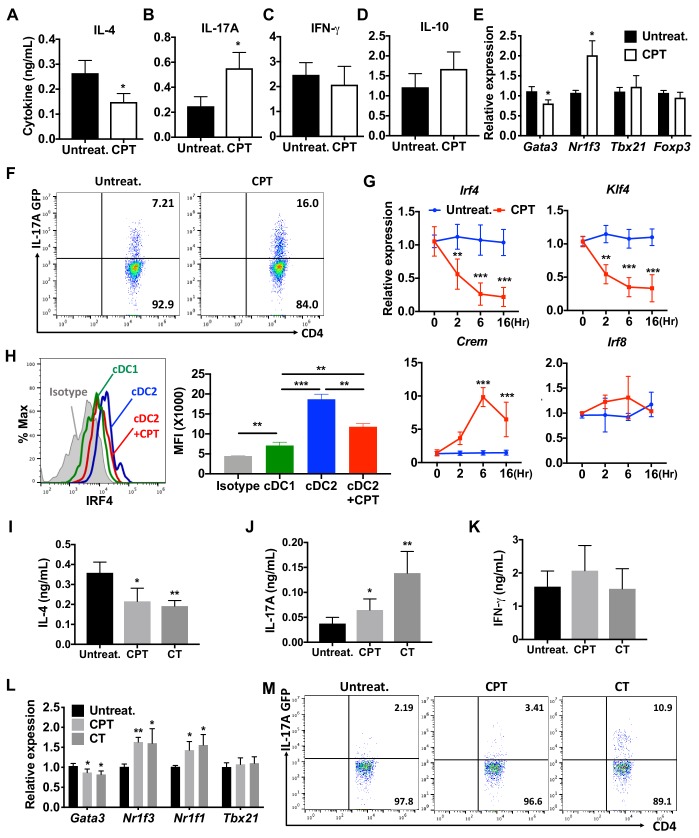
Figure 1.

Figure 1—figure supplement 1. cAMP signaling in cDC1s does not affect the expression of IRF and subsequent T cell differentiation.

Figure 1—figure supplement 1.

(A–C) IL-4, IL-17A and IFN-γ levels from anti-CD3/28 Ab-stimulated OT-II cells co-cultured with cDC1s (CD11c+CD11b-CD8α+) cells from WT mice pretreated with or without CPT. (D) qPCR analysis of lineage commitment factors in OT-II cells co-cultured with WT cDC1s in the presence of CPT. (E) Relative expression of TFs in WT cDC1s treated with CPT for indicated time. (F) IRF5 and (G) IRF8 expression in WT cDC1s and cDC2s. (H) IRF5 and (I) IRF8 expression in cDC1s and cDC2s after CPT treatment for 48 hr. Data are representative of three independent experiments; *p<0.05.
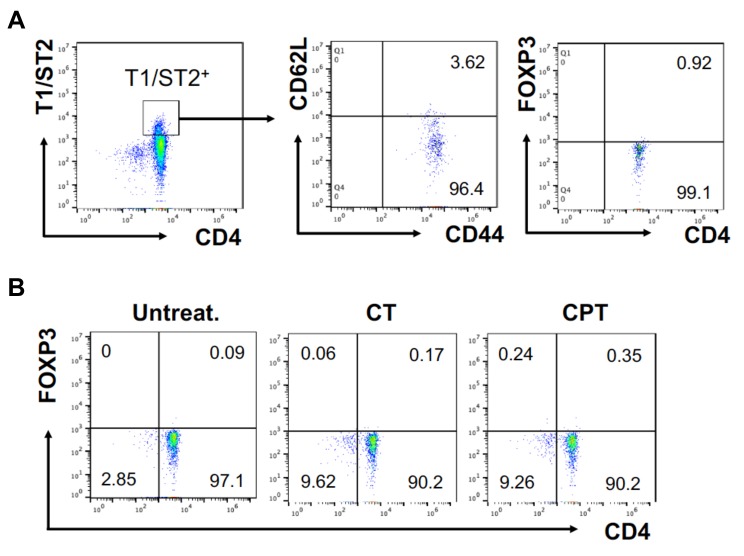
Figure 1—figure supplement 2. FOXP3 expression in T1/ST2+ cells OT-II CD4+ T cells were co-cultured with GnasΔCD11c BM-APCs to generate memory Th2 cells (1 st co-culture).

Figure 1—figure supplement 2.

From the 1 st co-culture, T1/ST2+ cells were FACS sorted and then used for co-culture with WT cDC2s pretreated with or without CPT or Cholera toxin (CT) (2nd co-culture). (A) Memory T cell marker and FOXP3 were analyzed in the 1 st co-cultured T cells. (B) FOXP3 were analyzed in the 2nd co-cultured T cells.
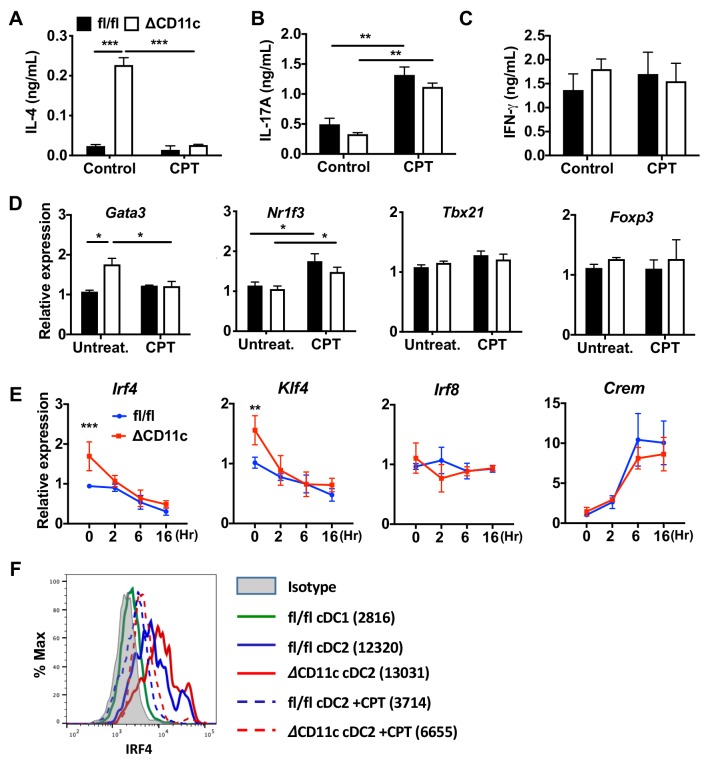
Figure 1—figure supplement 3. cAMP signaling switches a pro-Th2 GnasΔCD11c to a pro-Th17 phenotype.

Figure 1—figure supplement 3.

(A–C) IL-4, IL-17A and IFN-γ levels from anti-CD3/28 Ab-stimulated OT-II cells co-cultured with splenic cDC2s from Gnasfl/fl and GnasΔCD11c mice treated in the absence or presence of CPT. (D) qPCR analysis of lineage commitment factors in the isolated OT-II cells co-cultured with Gnasfl/fl or GnasΔCD11c cDC2s. (E) qPCR of TFs in CPT-treated Gnasfl/fl or GnasΔCD11c cDC2s. Two-way ANOVA with Sidak’s multiple comparisons test; **p<0.01, ***p<0.001. Effect of CPT treatment; Irf4 (p<0.001), Klf4 (p<0.001) and Crem (p<0.001). Effect of strain: Irf4 (p<0.001). (F) Intracellular staining (FACS) of IRF4 in untreated and CPT-treated Gnasfl/fl and GnasΔCD11c cDC2s for 48 hr. Data are representative of three independent experiments; *p<0.05, **p<0.01, ***p<0.001.
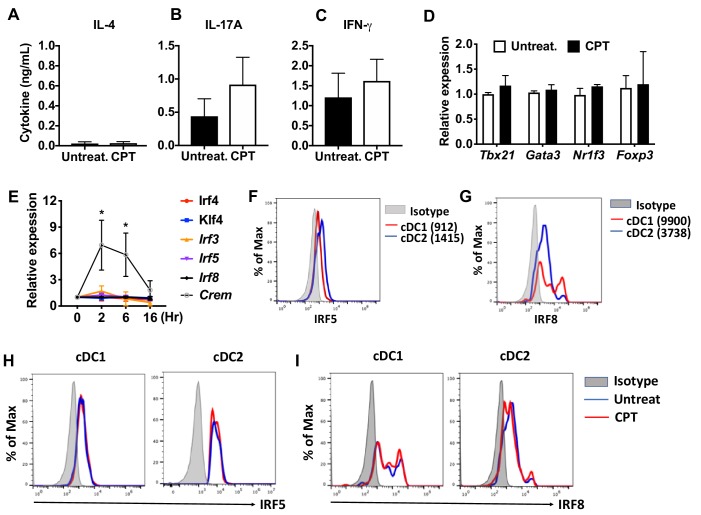
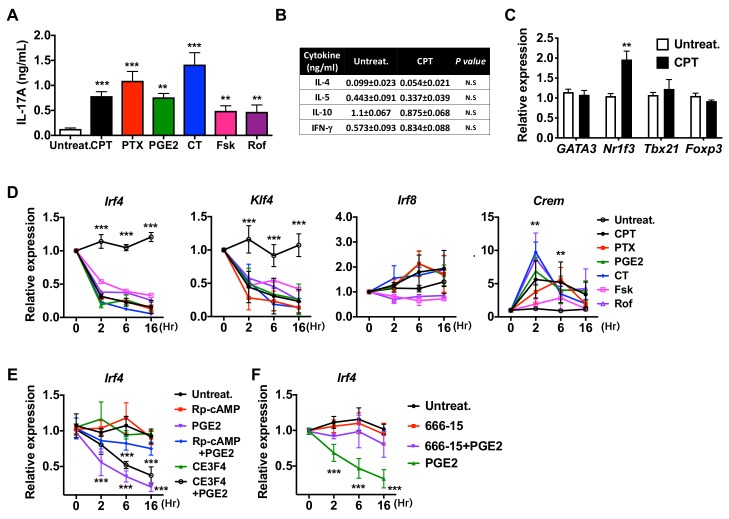
Figure 1—figure supplement 4. Induction of pro-Th17 BM-APCs and altered transcriptional program by cAMP agonists.

Figure 1—figure supplement 4.

(A) IL-17A levels from anti-CD3/28 Ab-stimulated OT-II cells co-cultured with BM-APCs from WT mice treated with various cAMP agonists: CPT (50 μM), pertussis toxin (PTX, which inhibits Gαi, 100 ng/ml), prostaglandin E2 (PGE2, 1 μM), cholera toxin (CT, an activator of Gαs, 1 μg/ml), forskolin (Fsk, an activator of AC, 10 μM), rolipram (Rol, PDE4 inhibitor, 10 μM). (B) Levels of the indicated cytokines and (C) mRNA expression of lineage commitment factors in OT-II cells co-cultured with WT BM-APCs treated with CPT. (D) QPCR of TFs in the WT BM-APCs treated with the indicated cAMP agonists. Two-way ANOVA with Sidak’s multiple comparisons test; n = 3 in each group, different from untreated in the CPT-treated group; *p<0.05, **p<0.01, ***p<0.001. Effect of treatment; Irf4 (p<0.001), Klf4 (p<0.001), Irf8 (p<0.001) and Crem (p<0.001). (E, F) qPCR of Irf4 in the WT BM-APCs treated with PGE2 in the presence of inhibitors of PKA (Rp-cAMP, 50 μM), EPAC (CE3F5, 50 μM), or CREB (666–15, 1 μM). Two-way ANOVA with Sidak’s multiple comparisons test; n = 3 in each group, different from untreated; ***p<0.001. Data are representative of three independent experiments.