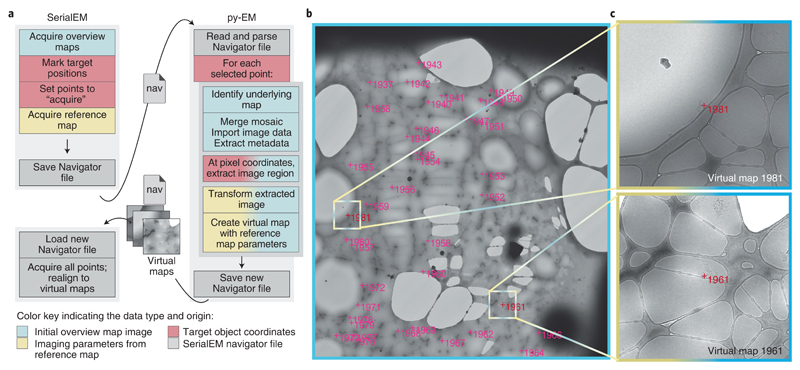
Figure 1.
Example application of the automatic generation of Virtual Maps to acquire TORC1 filamentous particles with cryo-EM. The color scheme illustrates the data type and origin as indicated in the bottom legend. a – The application workflow depicting the individual steps in the procedure and the communication and data transfer between SerialEM and py-EM using Navigator files and Virtual Map images. b – Overview map covering a single grid square. The magenta crosses indicate the target positions that were manually clicked within this map. Colored boxes and marks indicate the example regions where the corresponding Virtual Maps were extracted. c – Two example Virtual Maps that the script extracted from the map shown in c. The image data is extracted from the overview map while the microscope parameters are copied from the reference map. Scale: FOV of b: 47 μm; colored boxes in b, FOV of c: 3.8 μm. The presented experiment comprised 2500 points from 125 maps on one grid. The identical procedure was so far successfully applied in 9 experiments on different specimens.

