Figure 3.
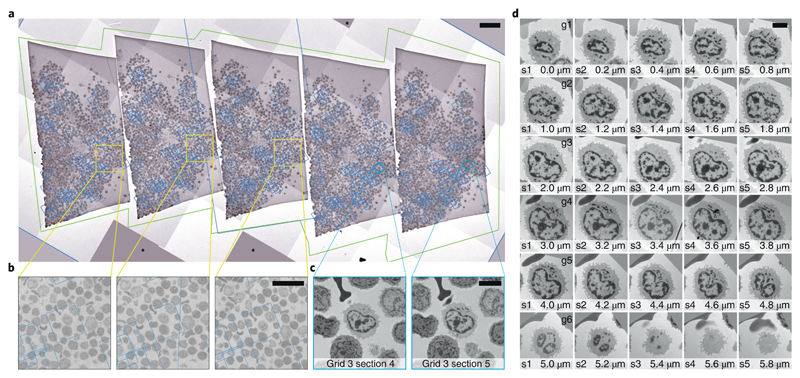
Automated acquisition of cells on serial sections. a – Overview of a ribbon of sections placed on a slot grid. The green outline marks the polygon used to acquire this Montage map. The blue boxes denote the location of the maps used to realign to each cell. b – Magnified regions in a showing the location of one cell of interest. The fact that the blue box that denotes the location of the corresponding maps is not precisely centered on the cell is not crucial for repositioning. The image information used for realigning is taken from the map itself. c – Two maps of a single cell on neighboring sections. These images are used during Realign to Item. d – Gallery of images of an individual cell across 30 sections (thickness: 200 nm) spread across 6 grids. The images were automatically aligned using TrakEM239. Another cell that spans cross 9 sections is shown in Supplementary Video 3. Scales: a: 50 μm, b: 20 μm, C/D: 5 μm. For the presented experiment we have followed a total of 120 cells across 100 sections on 20 grids for 3 different specimens.

