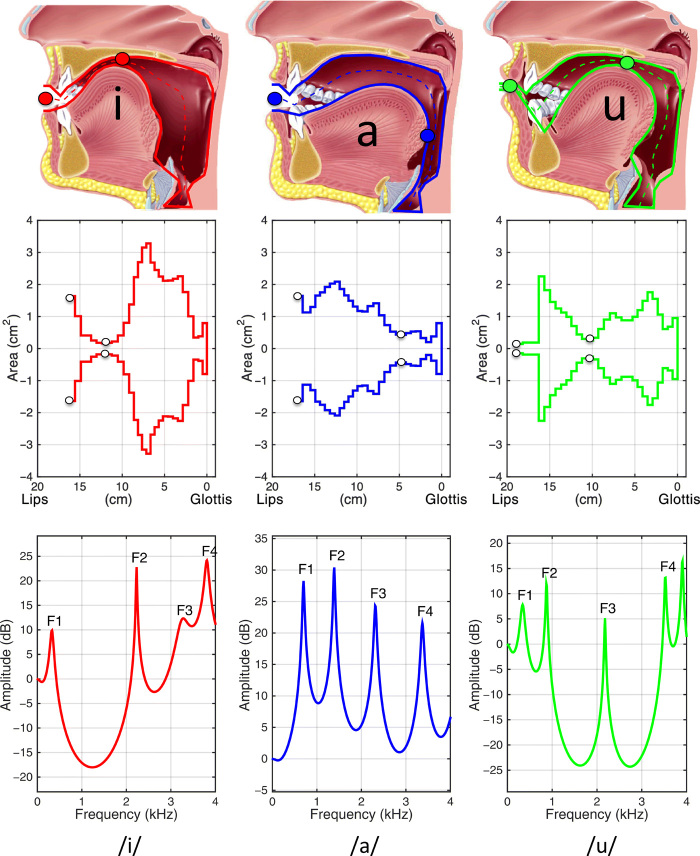
Fig. 2. Production of the three extreme vowels /i/, /a/, and /u/.
(Top) Sagittal section (with the median line along which the VTL is measured from glottis to lips) with dots indicating the lips (location of Al) and the vowel’s constriction (with location Xc and area Ac) along the VT. (Middle) Area function, with dots in corresponding locations. (Bottom) Acoustic transfer function, with the lowest formant peaks marked (F1 to F4).

