
Figure 1:
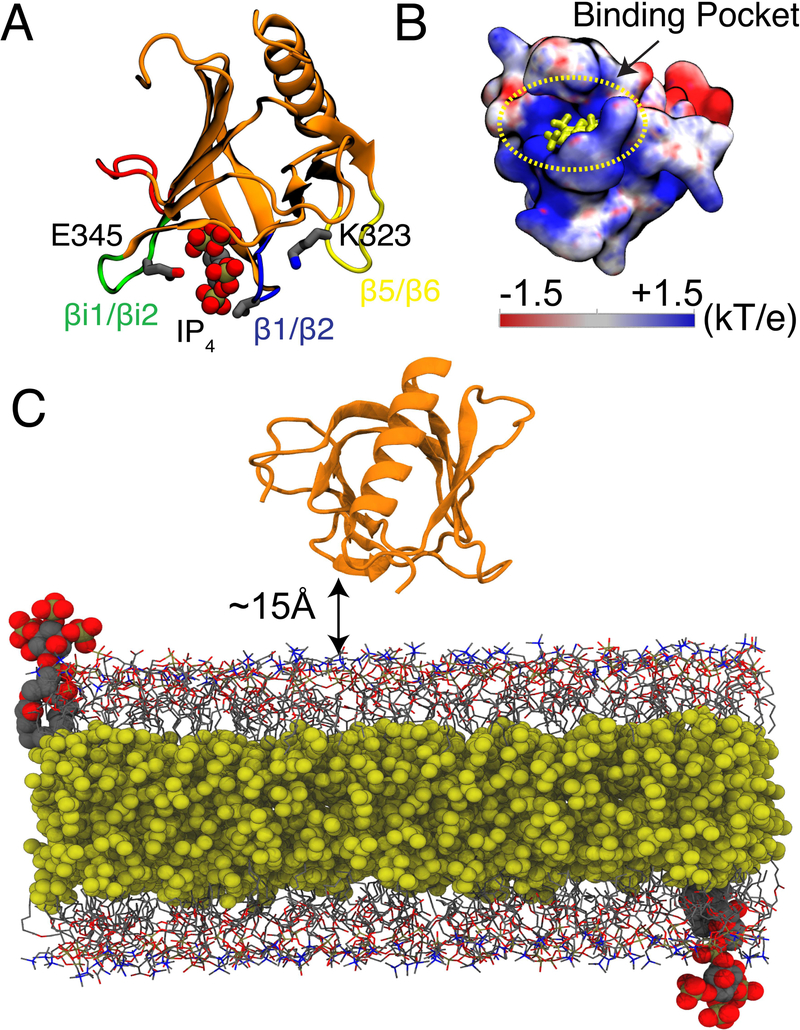
GRP1-PHD structure and simulation system. (A) The crystal structure of GRP1-PHD (PDB:1FGY)20 with co-crystalized IP4 representing the PIP3 lipid headgroup. The membrane interacting loops are as follows: β1/β2 (shown in blue), βi1/βi2 (shown in green), and β5/β6 (shown in yellow). (B) Electrostatic potential map of apo GRP1-PHD, IP4 is shown in yellow. The electrostatic map was generated using APBS software.21 Blue denotes positive potential surface and red denotes negative potential surface. (C) A representative simulation box for the HMMM membrane binding simulations of GRP1-PHD, which is initially placed at least 15 Å away from the membrane surface. Short-tailed PC and PS lipids are shown in grey lines and short-tailed PIP3 lipids (one in each leaflet corresponds to a molar ratio of 1%) are shown in vdW representation. The hydrophobic core of the membrane is filled with an organic solvent (DCLE), shown in yellow vdW representation. Bulk water molecules and ions are not shown for clarity.