Figure 2.

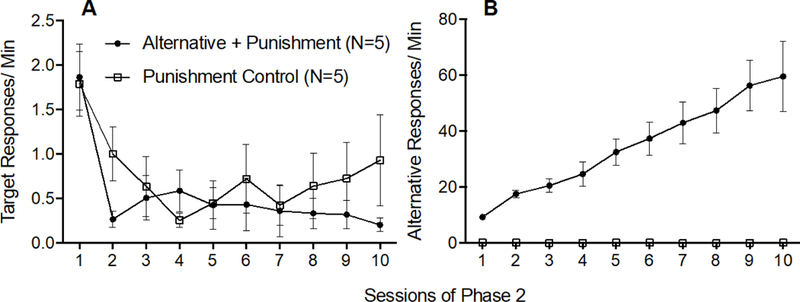
Target (A) and alternative (B) response rates across Phase 2 of Experiment 1. Error bars represent standard errors of the mean. Note difference in y-axes between panels A and B.

Target (A) and alternative (B) response rates across Phase 2 of Experiment 1. Error bars represent standard errors of the mean. Note difference in y-axes between panels A and B.