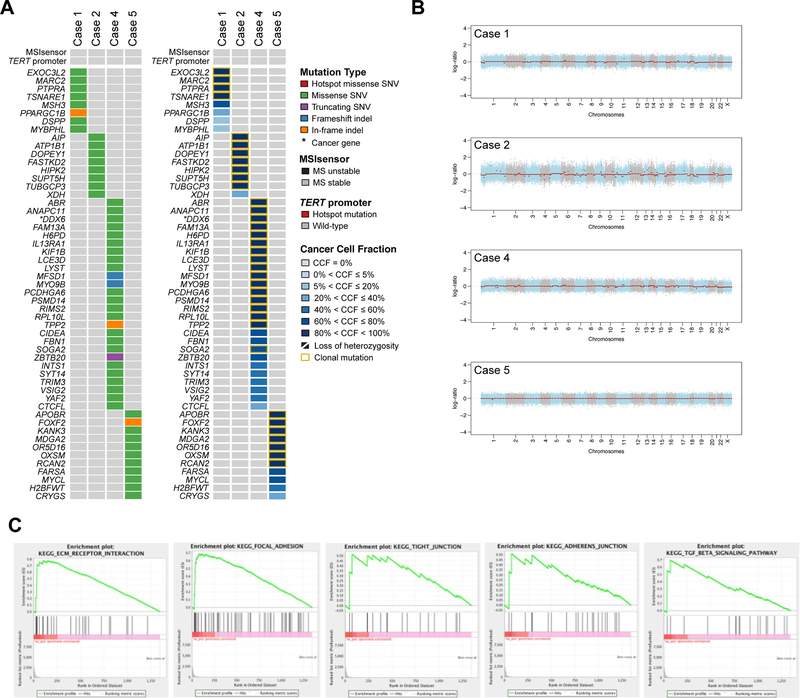
Figure 5. Genomic and transcriptomic characterization of sclerosing epithelioid mesenchymal neoplasm of the pancreas.
A) Non-synonymous somatic mutations in sclerosing epithelioid mesenchymal neoplasm of the pancreas detected by whole-exome sequencing. The mutation types (left) and cancer cell fractions of each mutation (right) are shown, color-coded according to the legend. The phenobar (top) provides information about the presence of TERT promoter hotspot mutations and the microsatellite instability sensor score (microsatellite instability). Indel, small insertion and deletion; MS, microsatellite; SNV, single nucleotide variant. B) Chromosome plots of the four sclerosing epithelioid mesenchymal neoplasm of the pancreas subjected to whole-exome sequencing. Log2-ratios plotted on the y‐axis according to their genomic coordinates on the x‐axis. C) Results of the Gene Set Enrichment Analysis of genes overexpressed in six sclerosing epithelioid mesenchymal neoplasm of the pancreas subjected to RNA-sequencing. The pathways found to be enriched are shown in the title of each plot.

