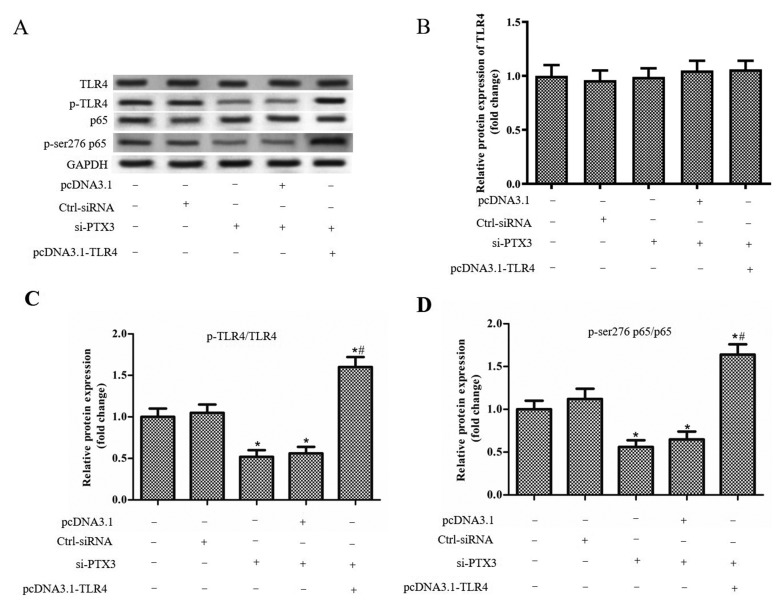
Figure 3. Silencing of PTX3 inhibits TLR4/NF-κB signaling pathway.
The BV2 cells were treated with LPS (1 µg/ml), and transfected with Ctrl-siRNA, si-PTX3, si-PTX3+pcDNA3.1 and si-PTX3+pcDNA3.1-TLR4, respectively. (A) Western blot was performed to confirm the protein expression levels of TLR4, p-TLR4, NF-κB, p65 and p-p65. (B) The protein expression of TLR4 in each group. (C) The protein expression of p-TLR4/TLR4 in each group. (D) The protein expression of p-p65/p65 in each group. ‘*’ means compared with the untreated group at P<0.05, and ‘#’ means compared with the si-PTX3+pcDNA3.1 group at P<0.05. GAPDH was used as an invariant internal control for calculating protein fold changes.

