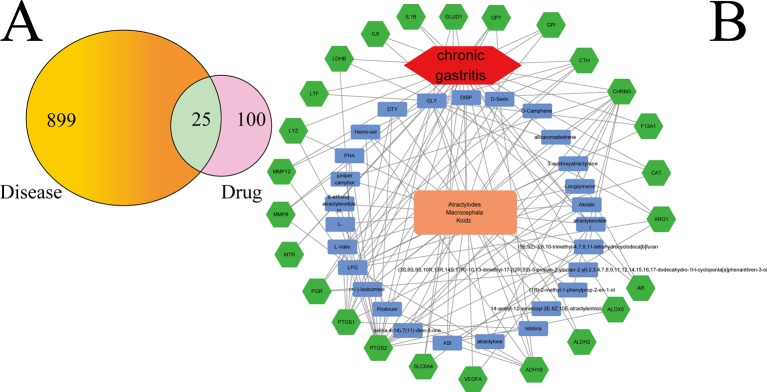
Figure 2.
(A) Twenty-five overlapping gene symbols between the disease and drug. (B) D-I-G-D network. The orange node represents AMK and the red node represents CG. The 27 blue nodes represent the active ingredients in AMK; The 25 green nodes represent the overlapping gene symbols between the disease and drug. The edges denote that nodes can interact with each other.

