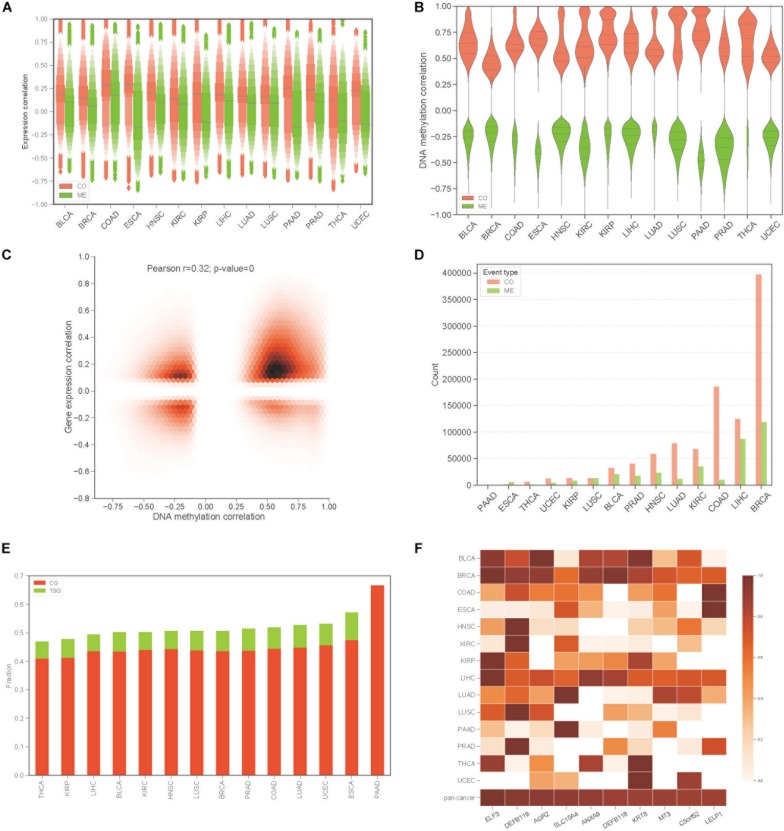
FIGURE 1.
Identification of co-occurrence and mutual exclusivity events of methylation. (A) Letter value (LV) plot of Pearson’s correlation coefficient of gene expression level between gene pairs for CO and ME events. (B) Pearson’s correlation plot of DNA methylation between gene pairs. (C) Jointplot of Pearson’s correlation coefficient between gene expression and DNA methylation for COME gene pairs. (D) Countplot of COME events in 14 cancers. (E) The proportion of cancer genes and tumor suppressor genes against all of the genes involving in COME events in different cancers. (F) Degree distribution of top 10 genes in pan-cancer network for each cancer and pan-cancer.

